01
Source Systems
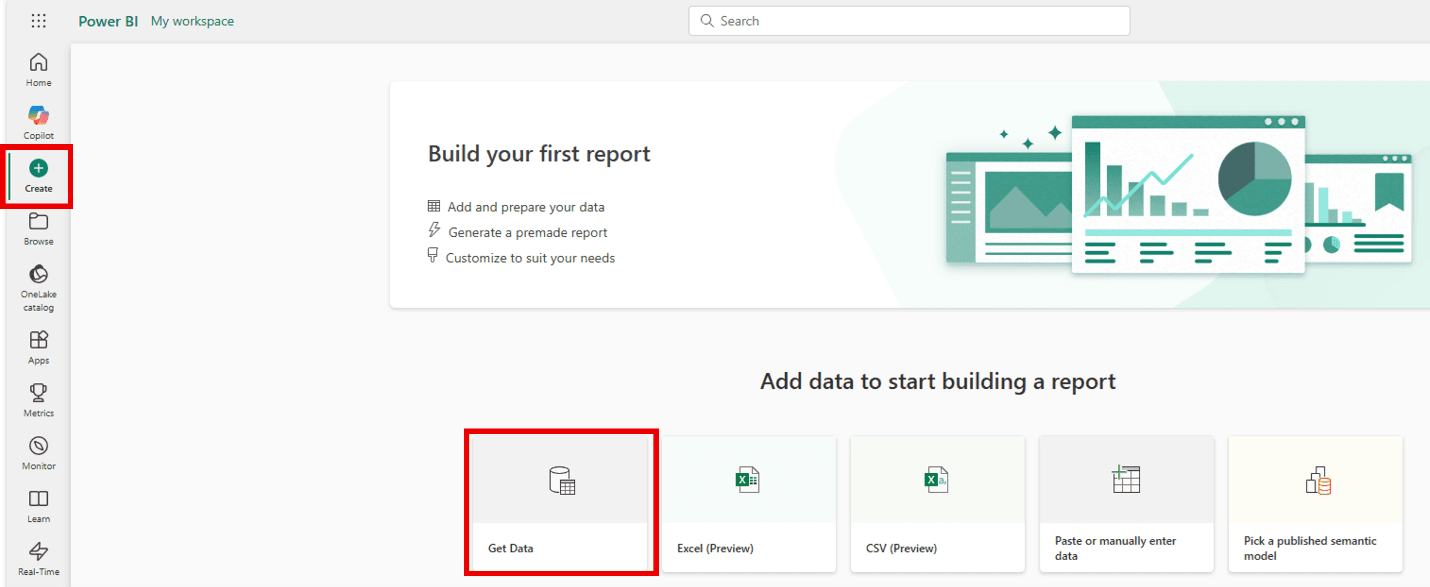
Map where data lives today: Excel, SQL Server, Azure SQL, APIs, SharePoint, CSV exports, SaaS tools, and legacy databases.
Image: Power BI Get data
Excel, SQL, APIs, SharePoint, gateways
Power BI & Microsoft Data Architecture
A useful Power BI dashboard is the final layer. Before that, you need clean data, agreed KPIs, a reliable model, secure access, automated refreshes, and a deployment process your team can trust.
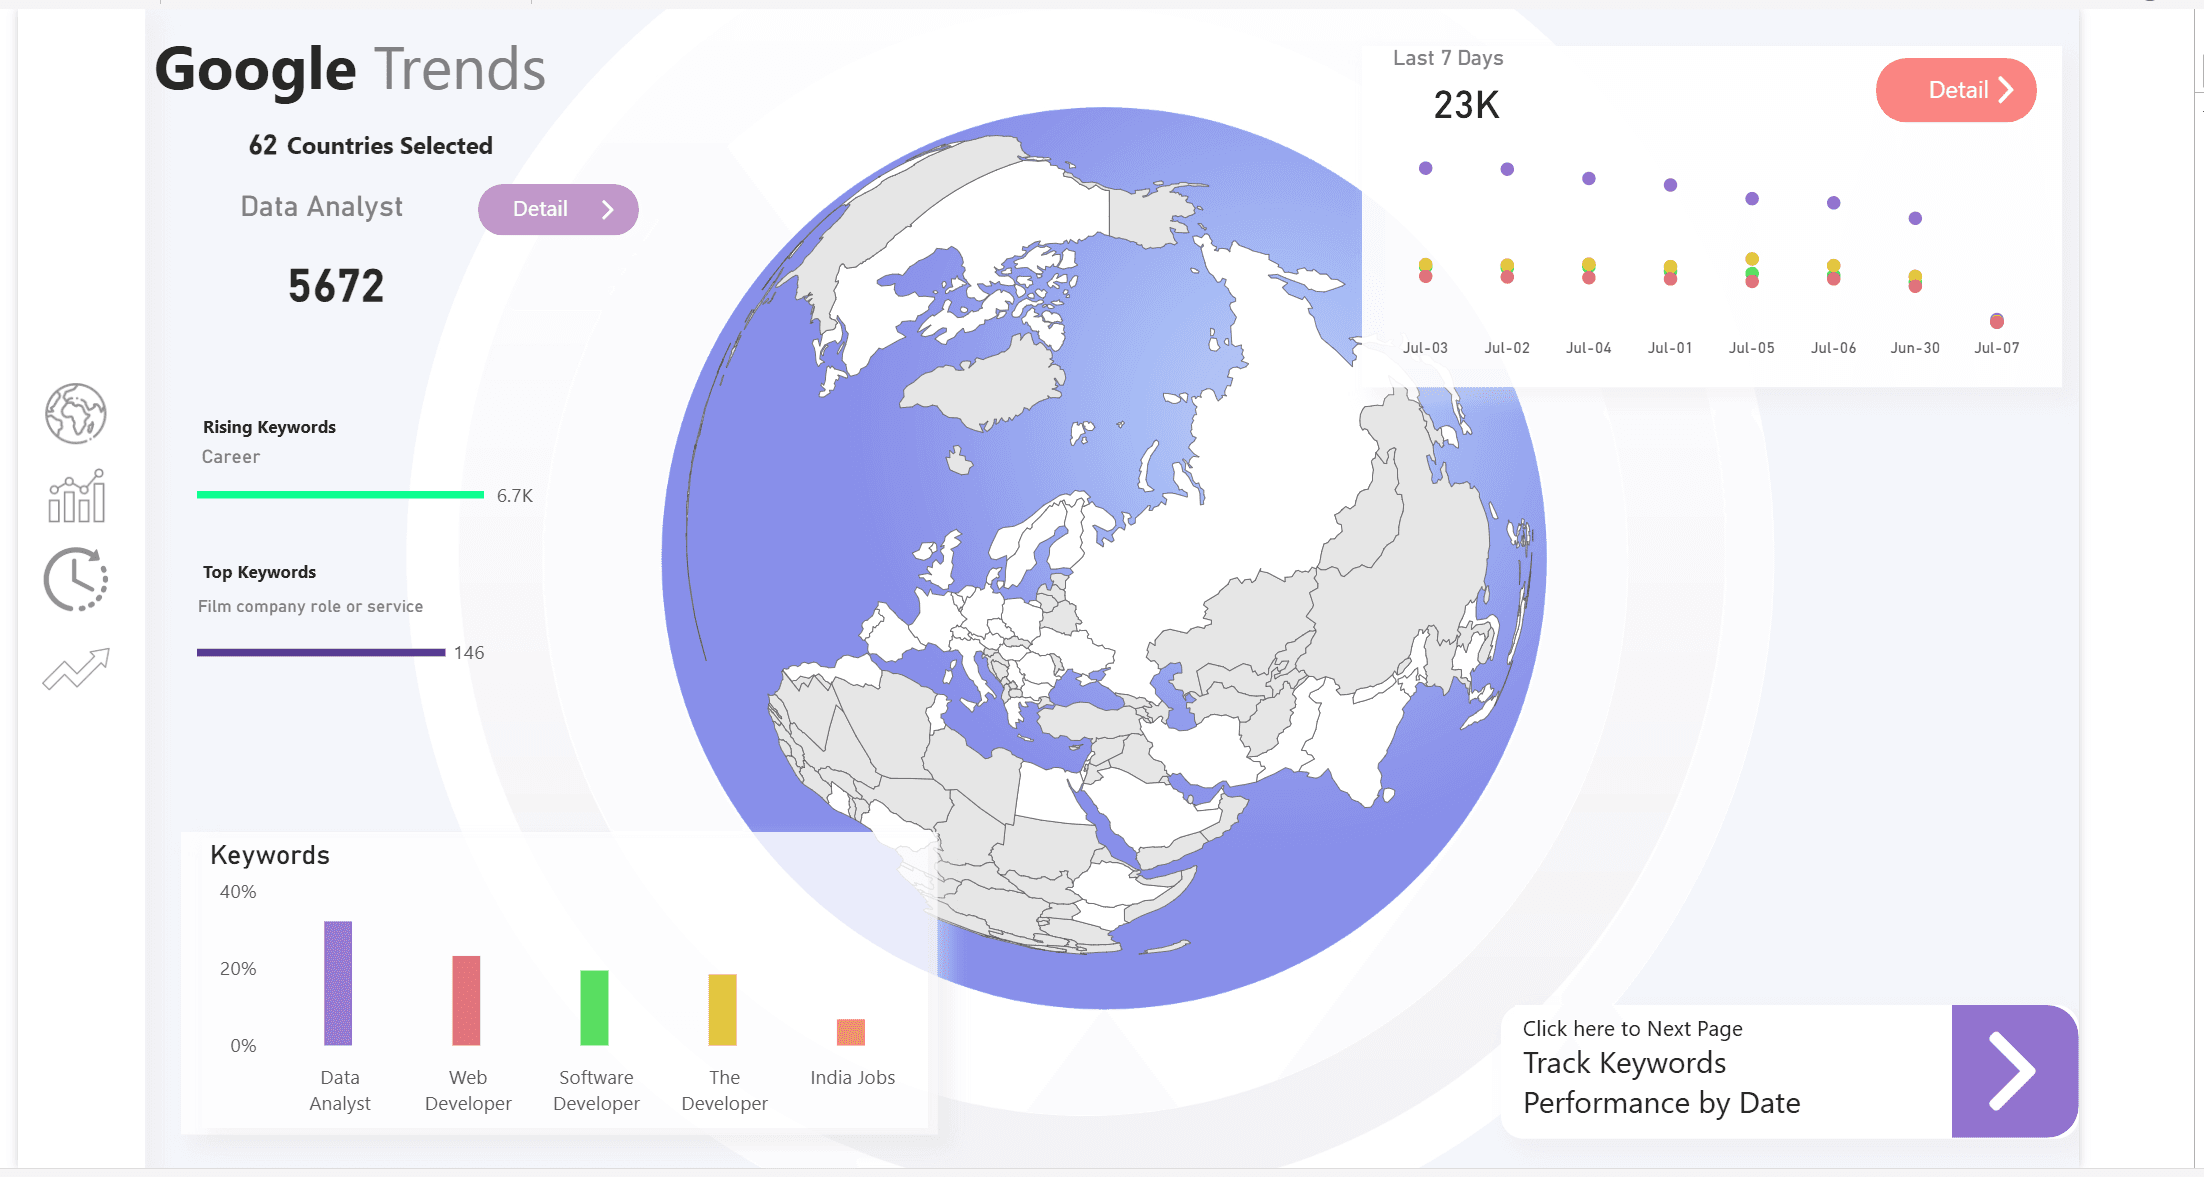
Project screenshot showing the dashboard layer clients see after the data model is working.
Power BI style reporting5+ yrs
Power BI & data work
3 UN agencies
Enterprise reporting context
15+ municipalities
Revenue analytics rollout
End-to-end
From sources to adoption
Architecture
The goal is not to create more charts. The goal is to create a trusted reporting system where every number has a source, owner, definition, refresh path, and security model.
01
Map where data lives today: Excel, SQL Server, Azure SQL, APIs, SharePoint, CSV exports, SaaS tools, and legacy databases.
Image: Power BI Get data
Excel, SQL, APIs, SharePoint, gateways
02
Move and transform data with the right tool for the job: Fabric Data Factory, Power Query, dataflows, notebooks, or Azure Data Factory.
Fabric Data Factory, Power Query, ADF
03
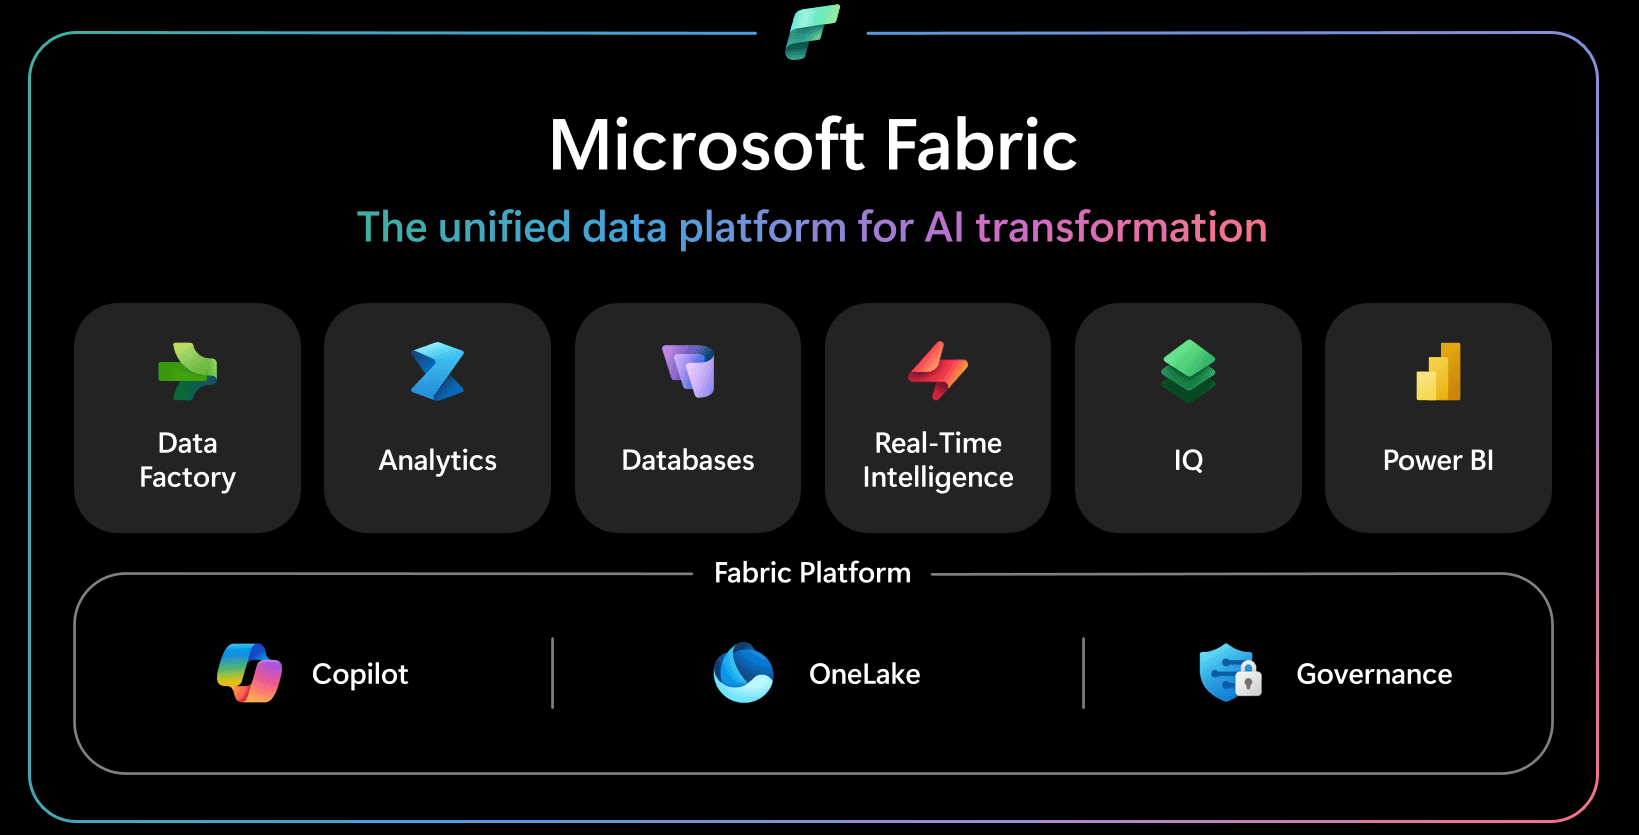
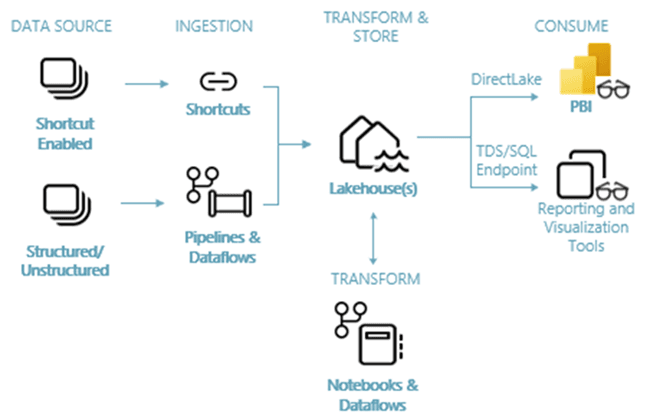
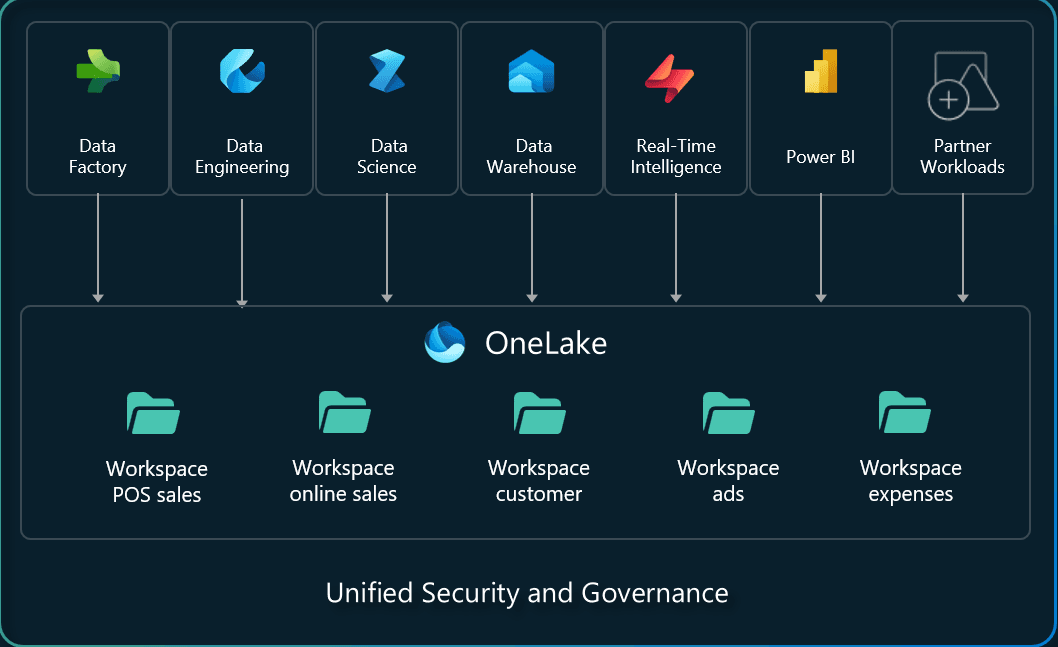
Design the durable layer for analytics: OneLake, Lakehouse, Warehouse, SQL Server, Azure SQL, or a hybrid architecture.
Image: OneLake overview
OneLake, Lakehouse, Warehouse, SQL
04
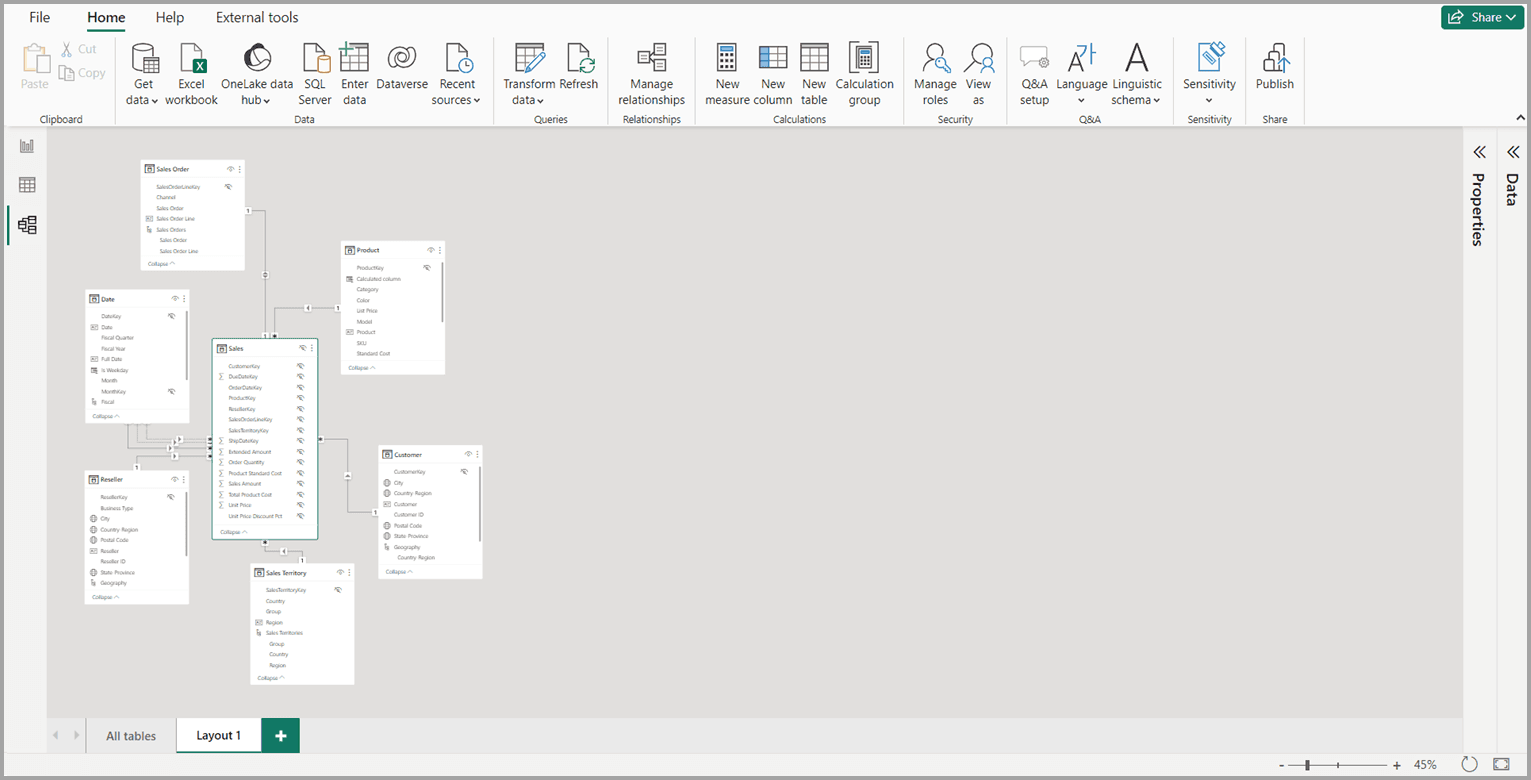
Build trusted business definitions with star schemas, relationships, measures, hierarchies, calendars, and reusable DAX.
Image: Power BI model view
Power BI semantic models, DAX
05
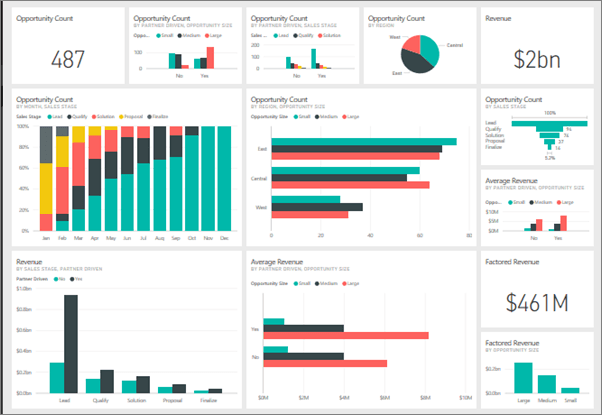
Create executive dashboards, operational reports, drill-through pages, Top-N analysis, maps, trend views, and mobile layouts.
Image: Power BI dashboards
Power BI reports, bookmarks, alerts
06
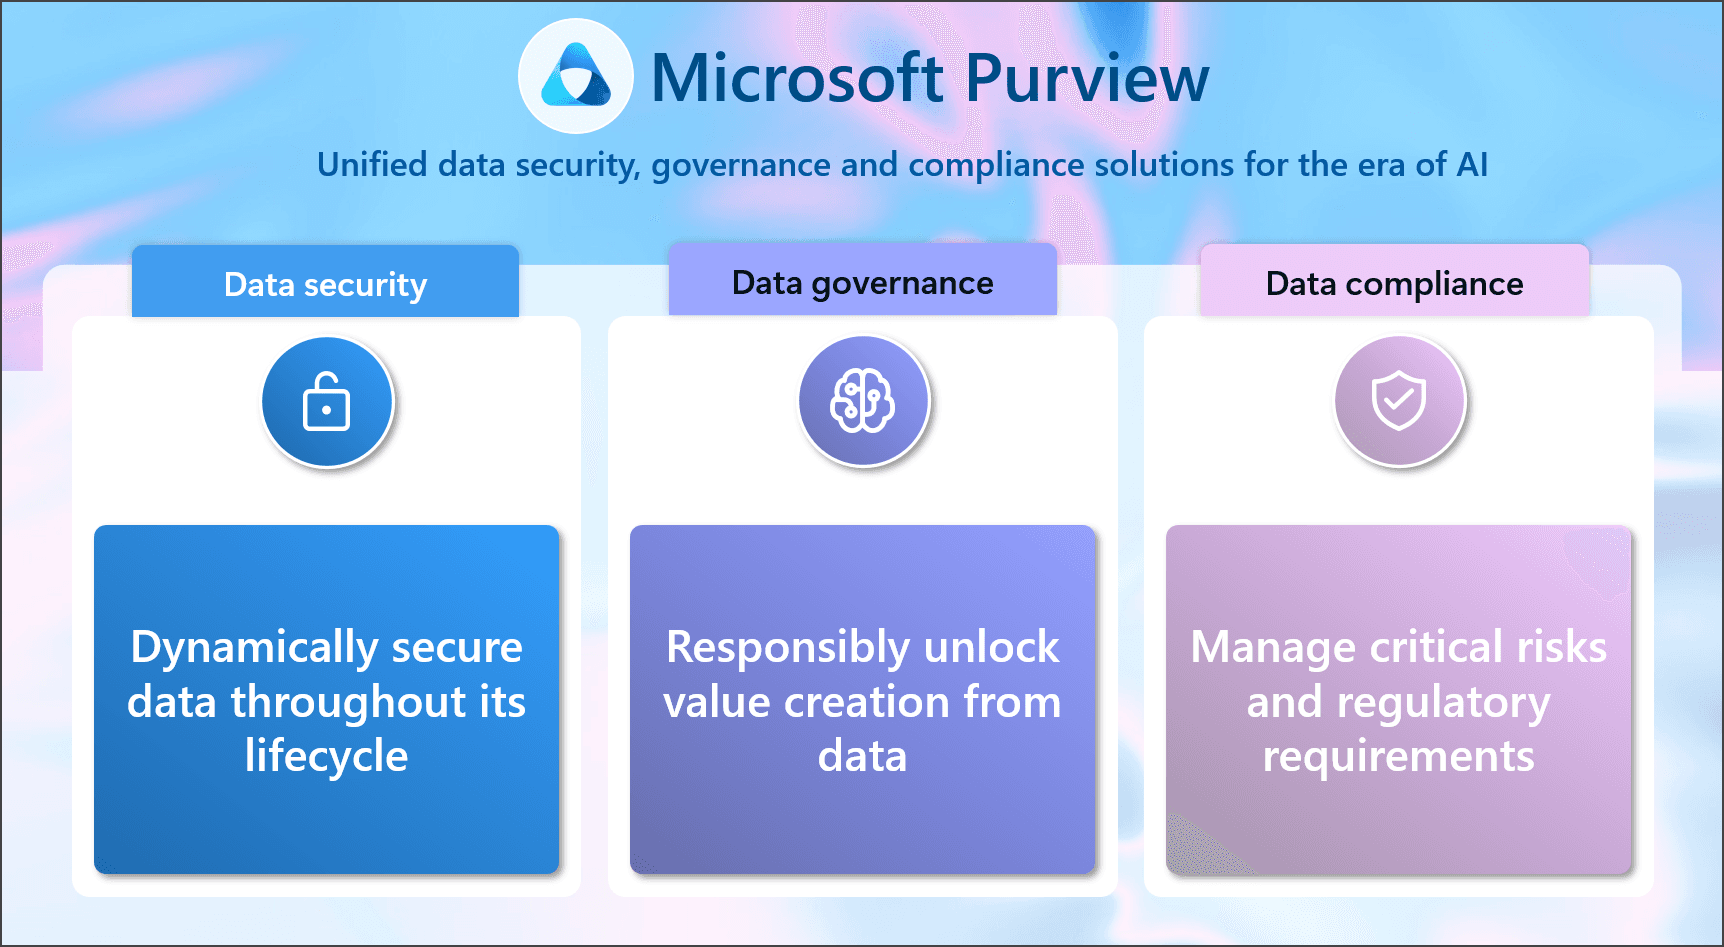
Add the controls that make reporting production-ready: row-level security, sensitivity labels, refresh strategy, deployment pipelines, and handover docs.
Image: Microsoft Purview
RLS, Purview, pipelines, refresh
Deliverables
KPI discovery workshop and reporting requirements document
Data source inventory with ownership, refresh frequency, and quality risks
Microsoft architecture recommendation: Fabric, SQL Server, Azure SQL, or hybrid
ETL and transformation design with reusable Power Query or Data Factory patterns
Clean star-schema data model with DAX measures and a governed KPI dictionary
Power BI dashboards for executives, operations teams, and analysts
Row-level security, workspace access model, and sharing strategy
Scheduled refresh, incremental refresh plan, alerts, and deployment process
Documentation, training session, and 30-day post-launch support
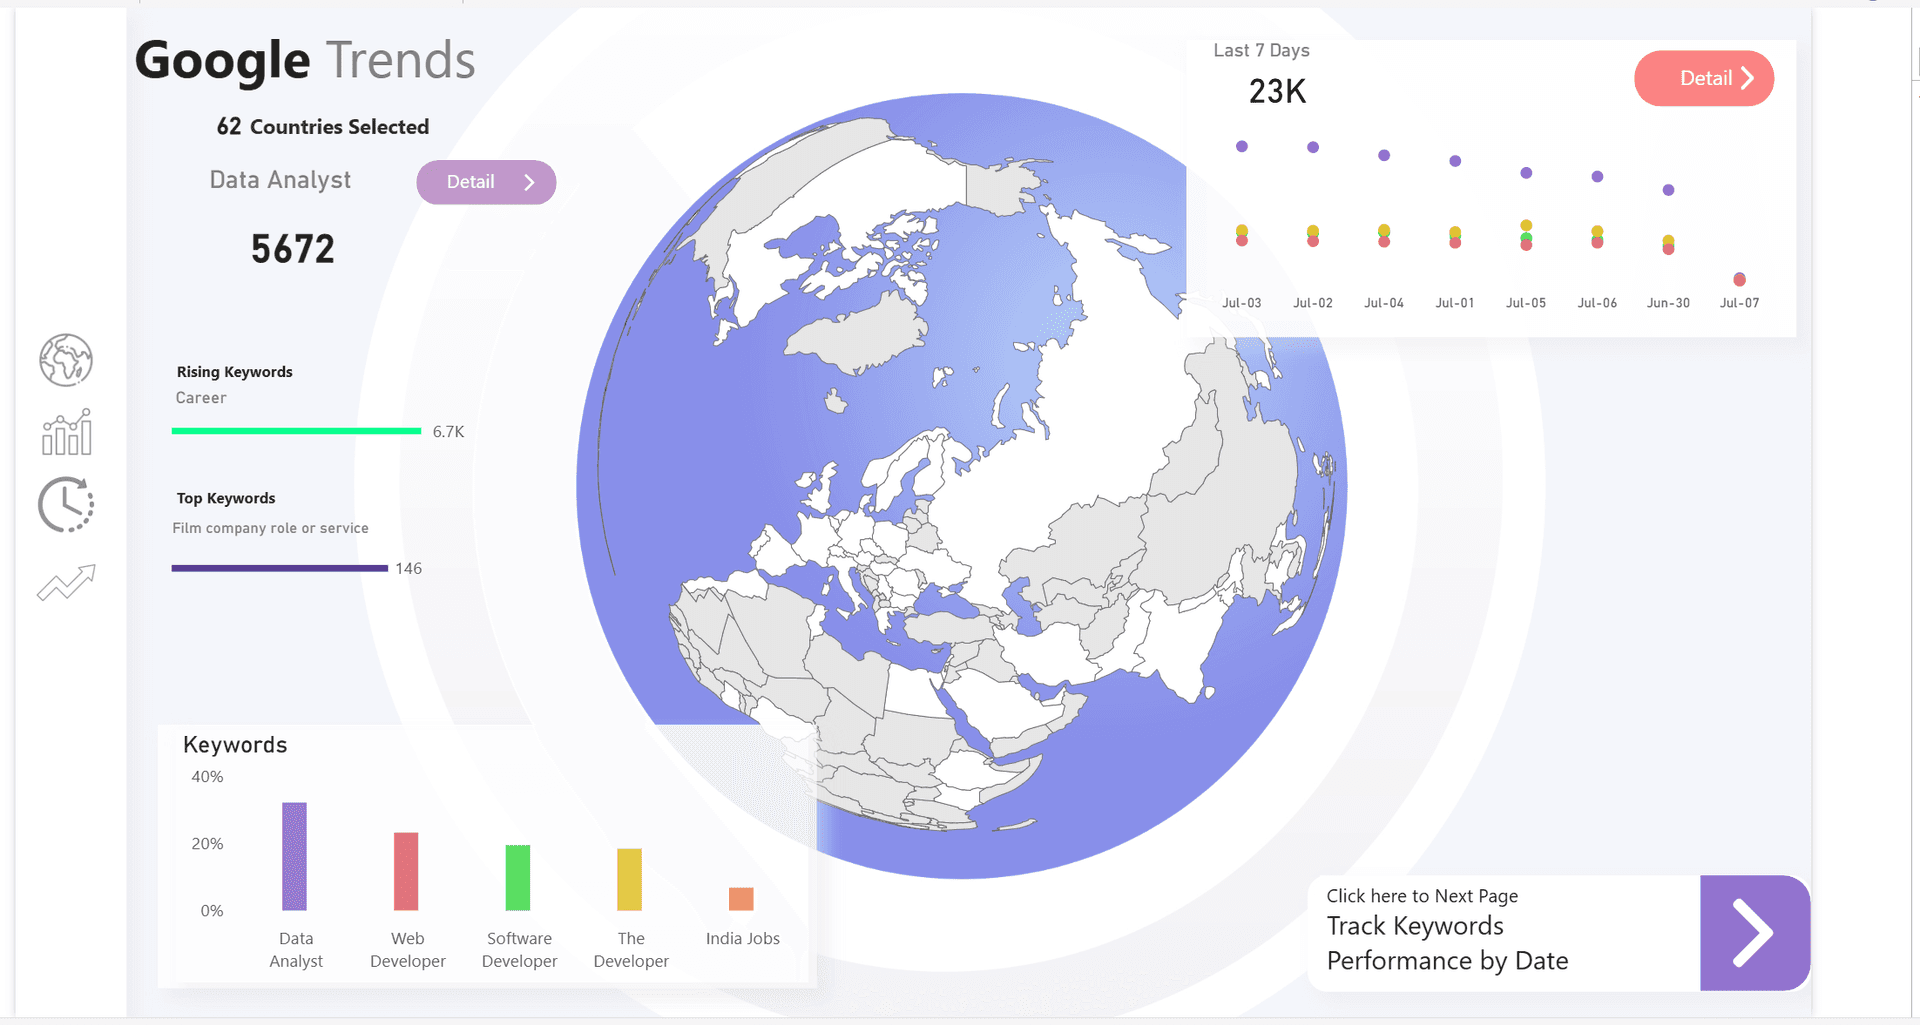
Dashboard Examples
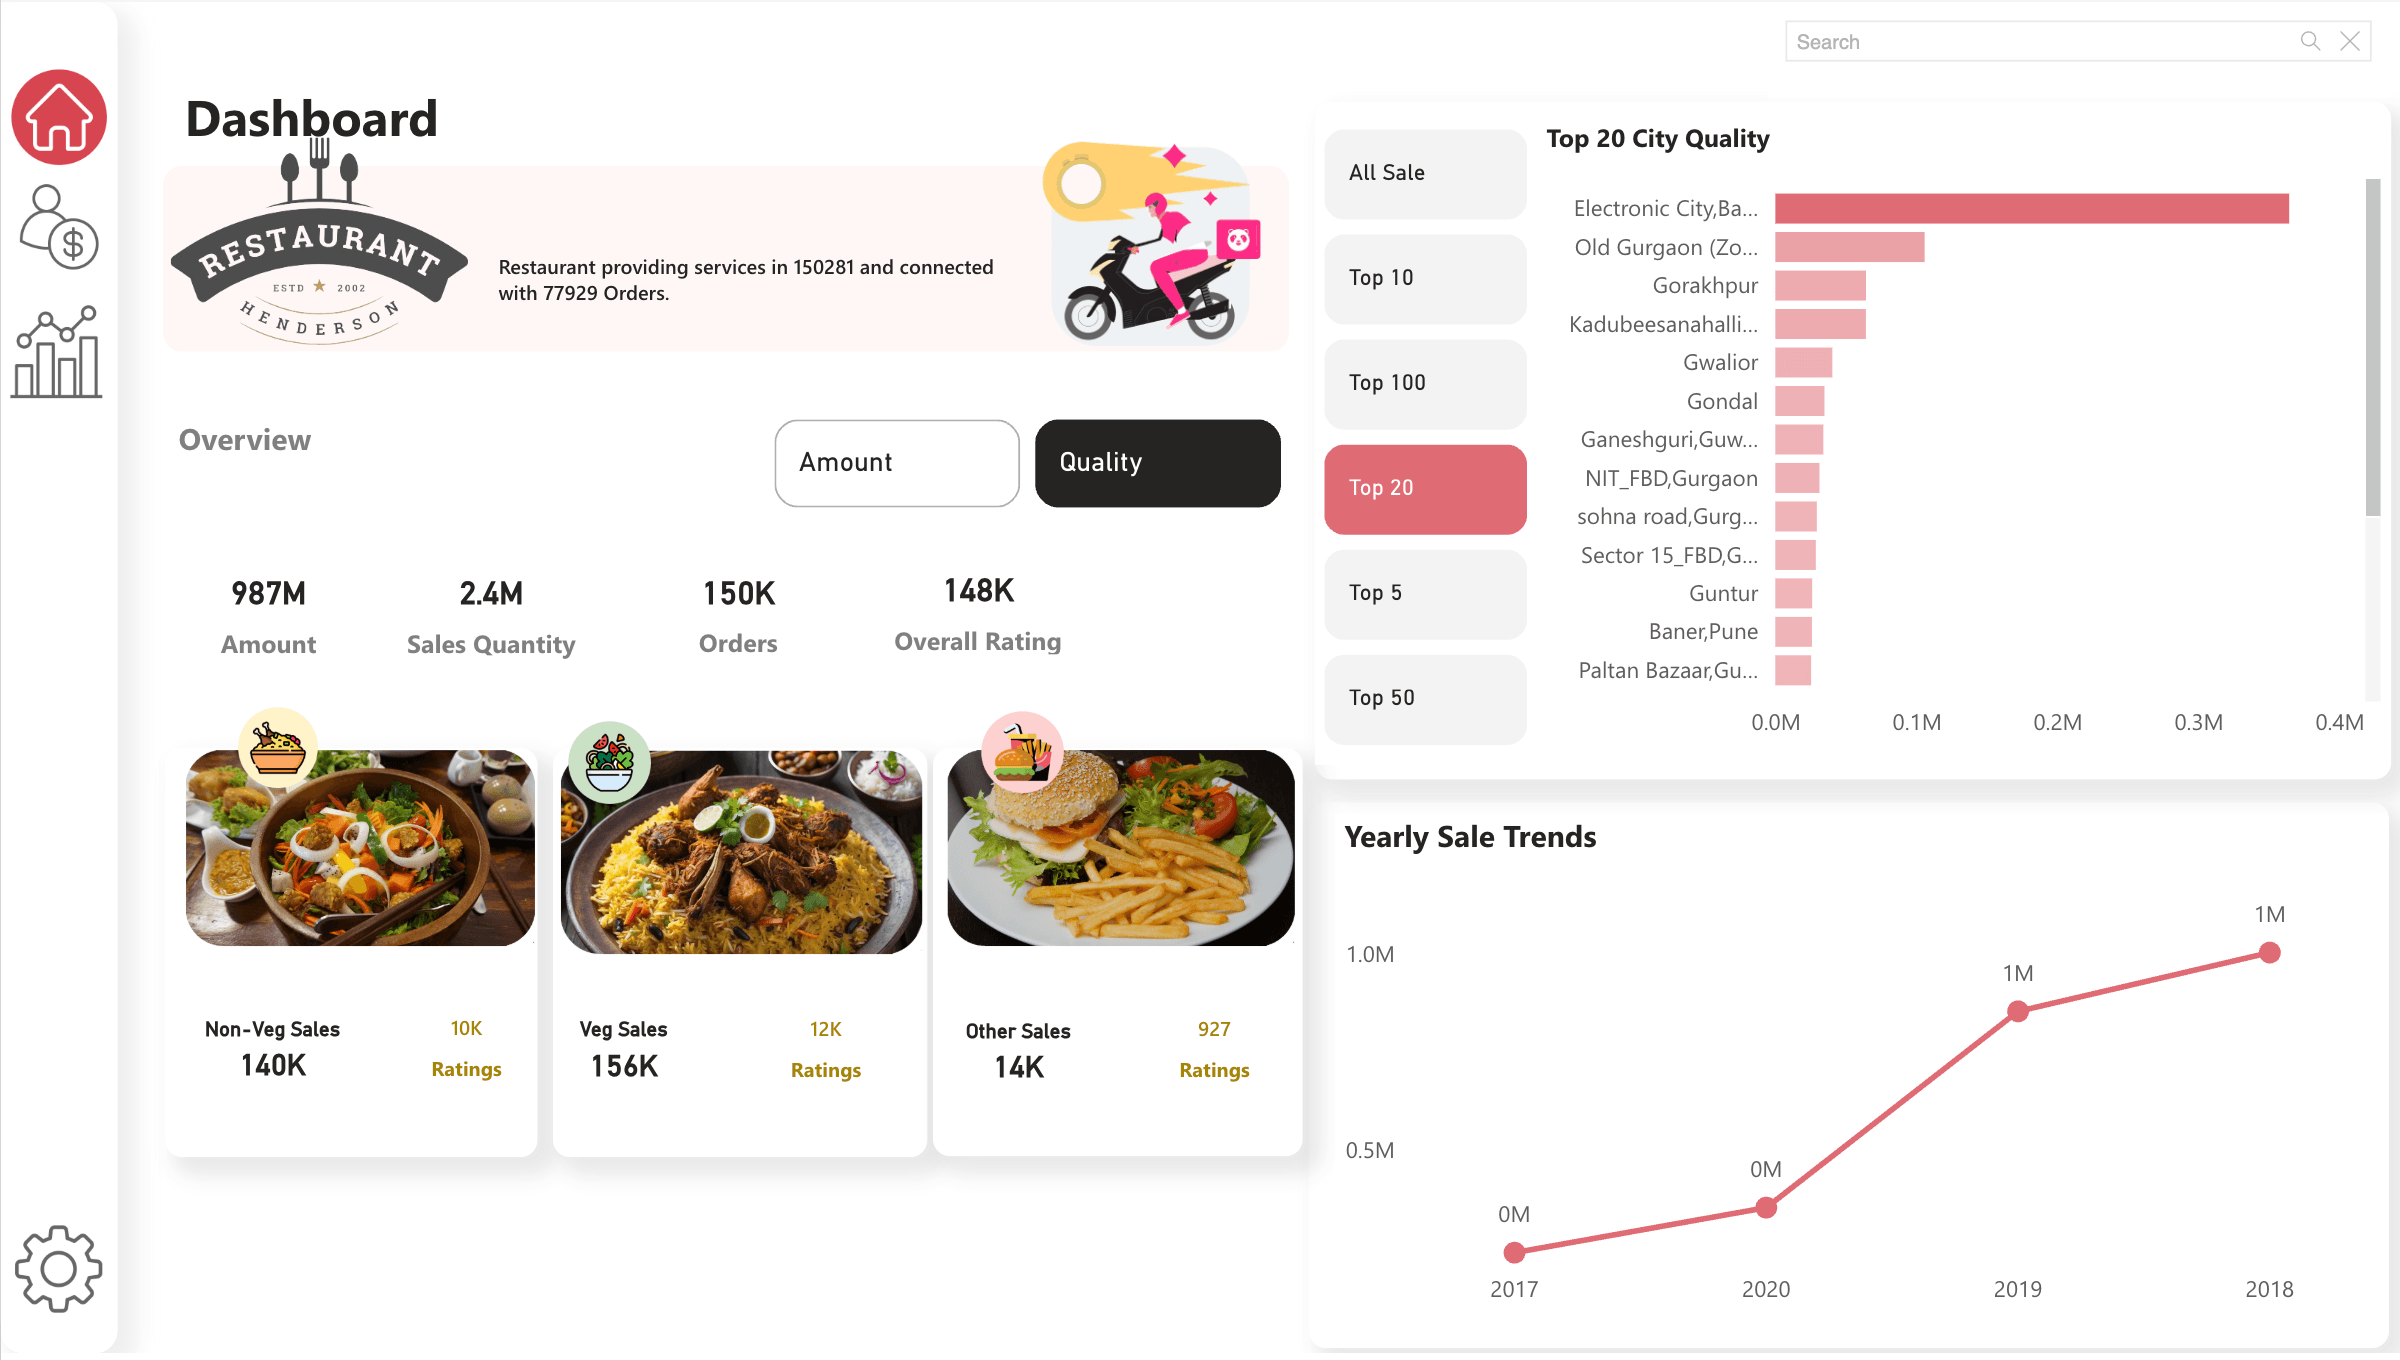
Sales, order quality, ratings, Top-N city analysis, food category cards, and yearly sales trends.
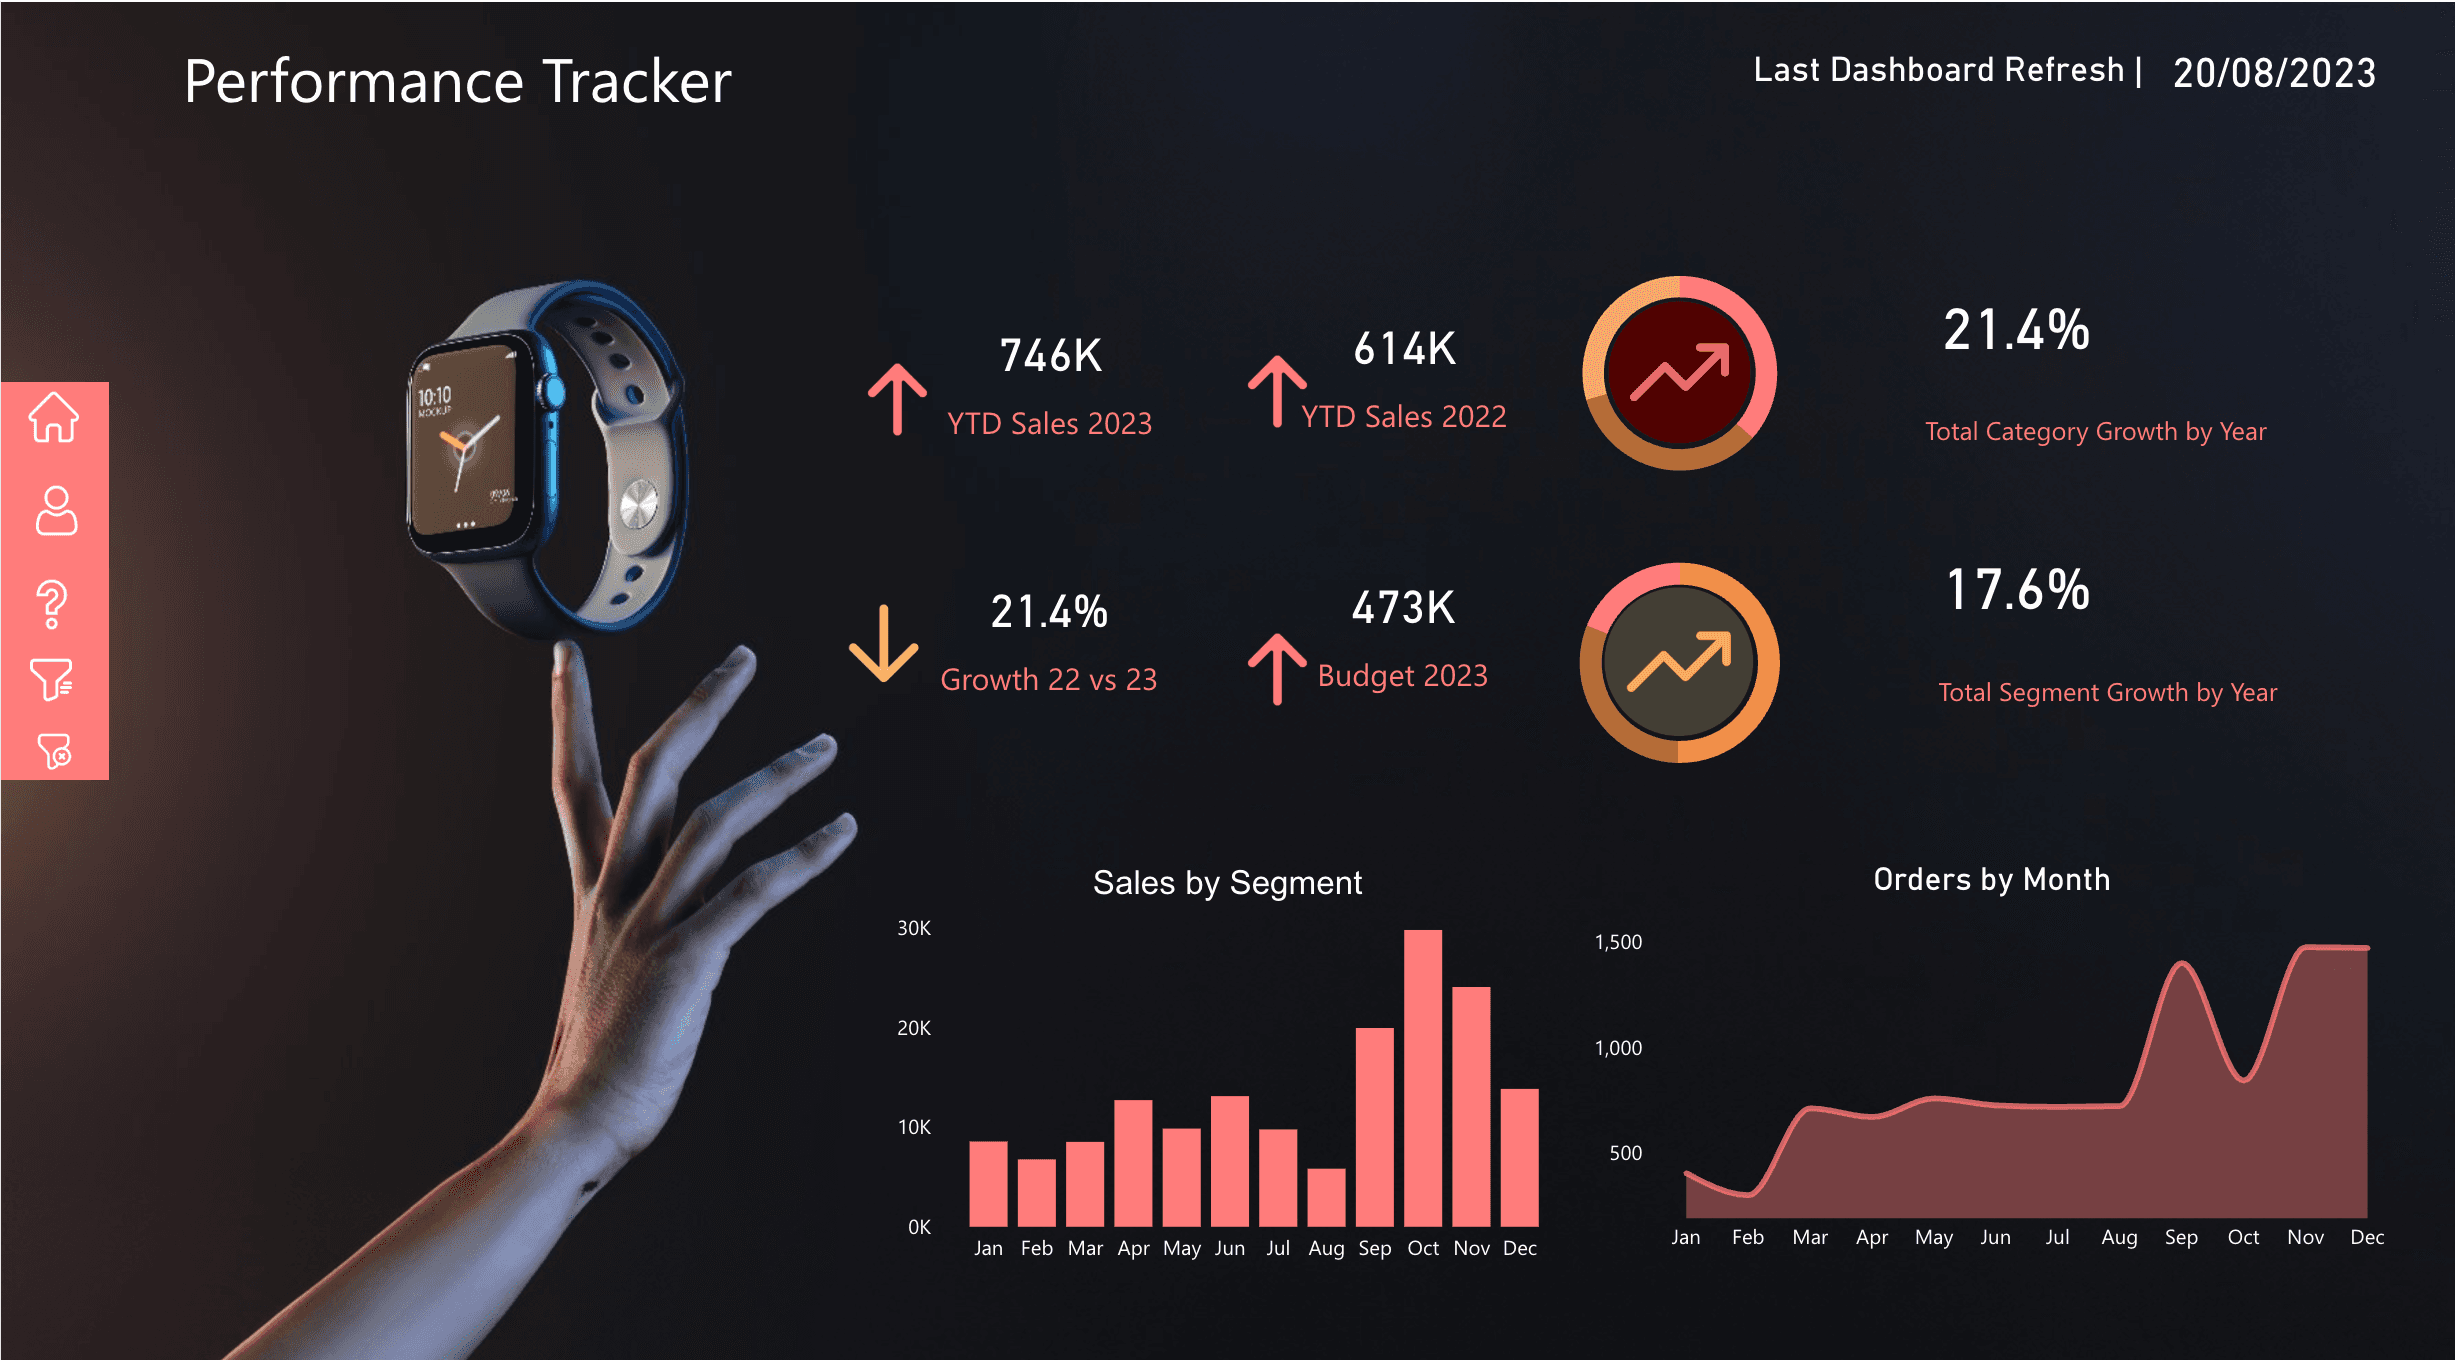
YTD sales, budget, growth, segment mix, monthly orders, and last-refresh status in one decision view.
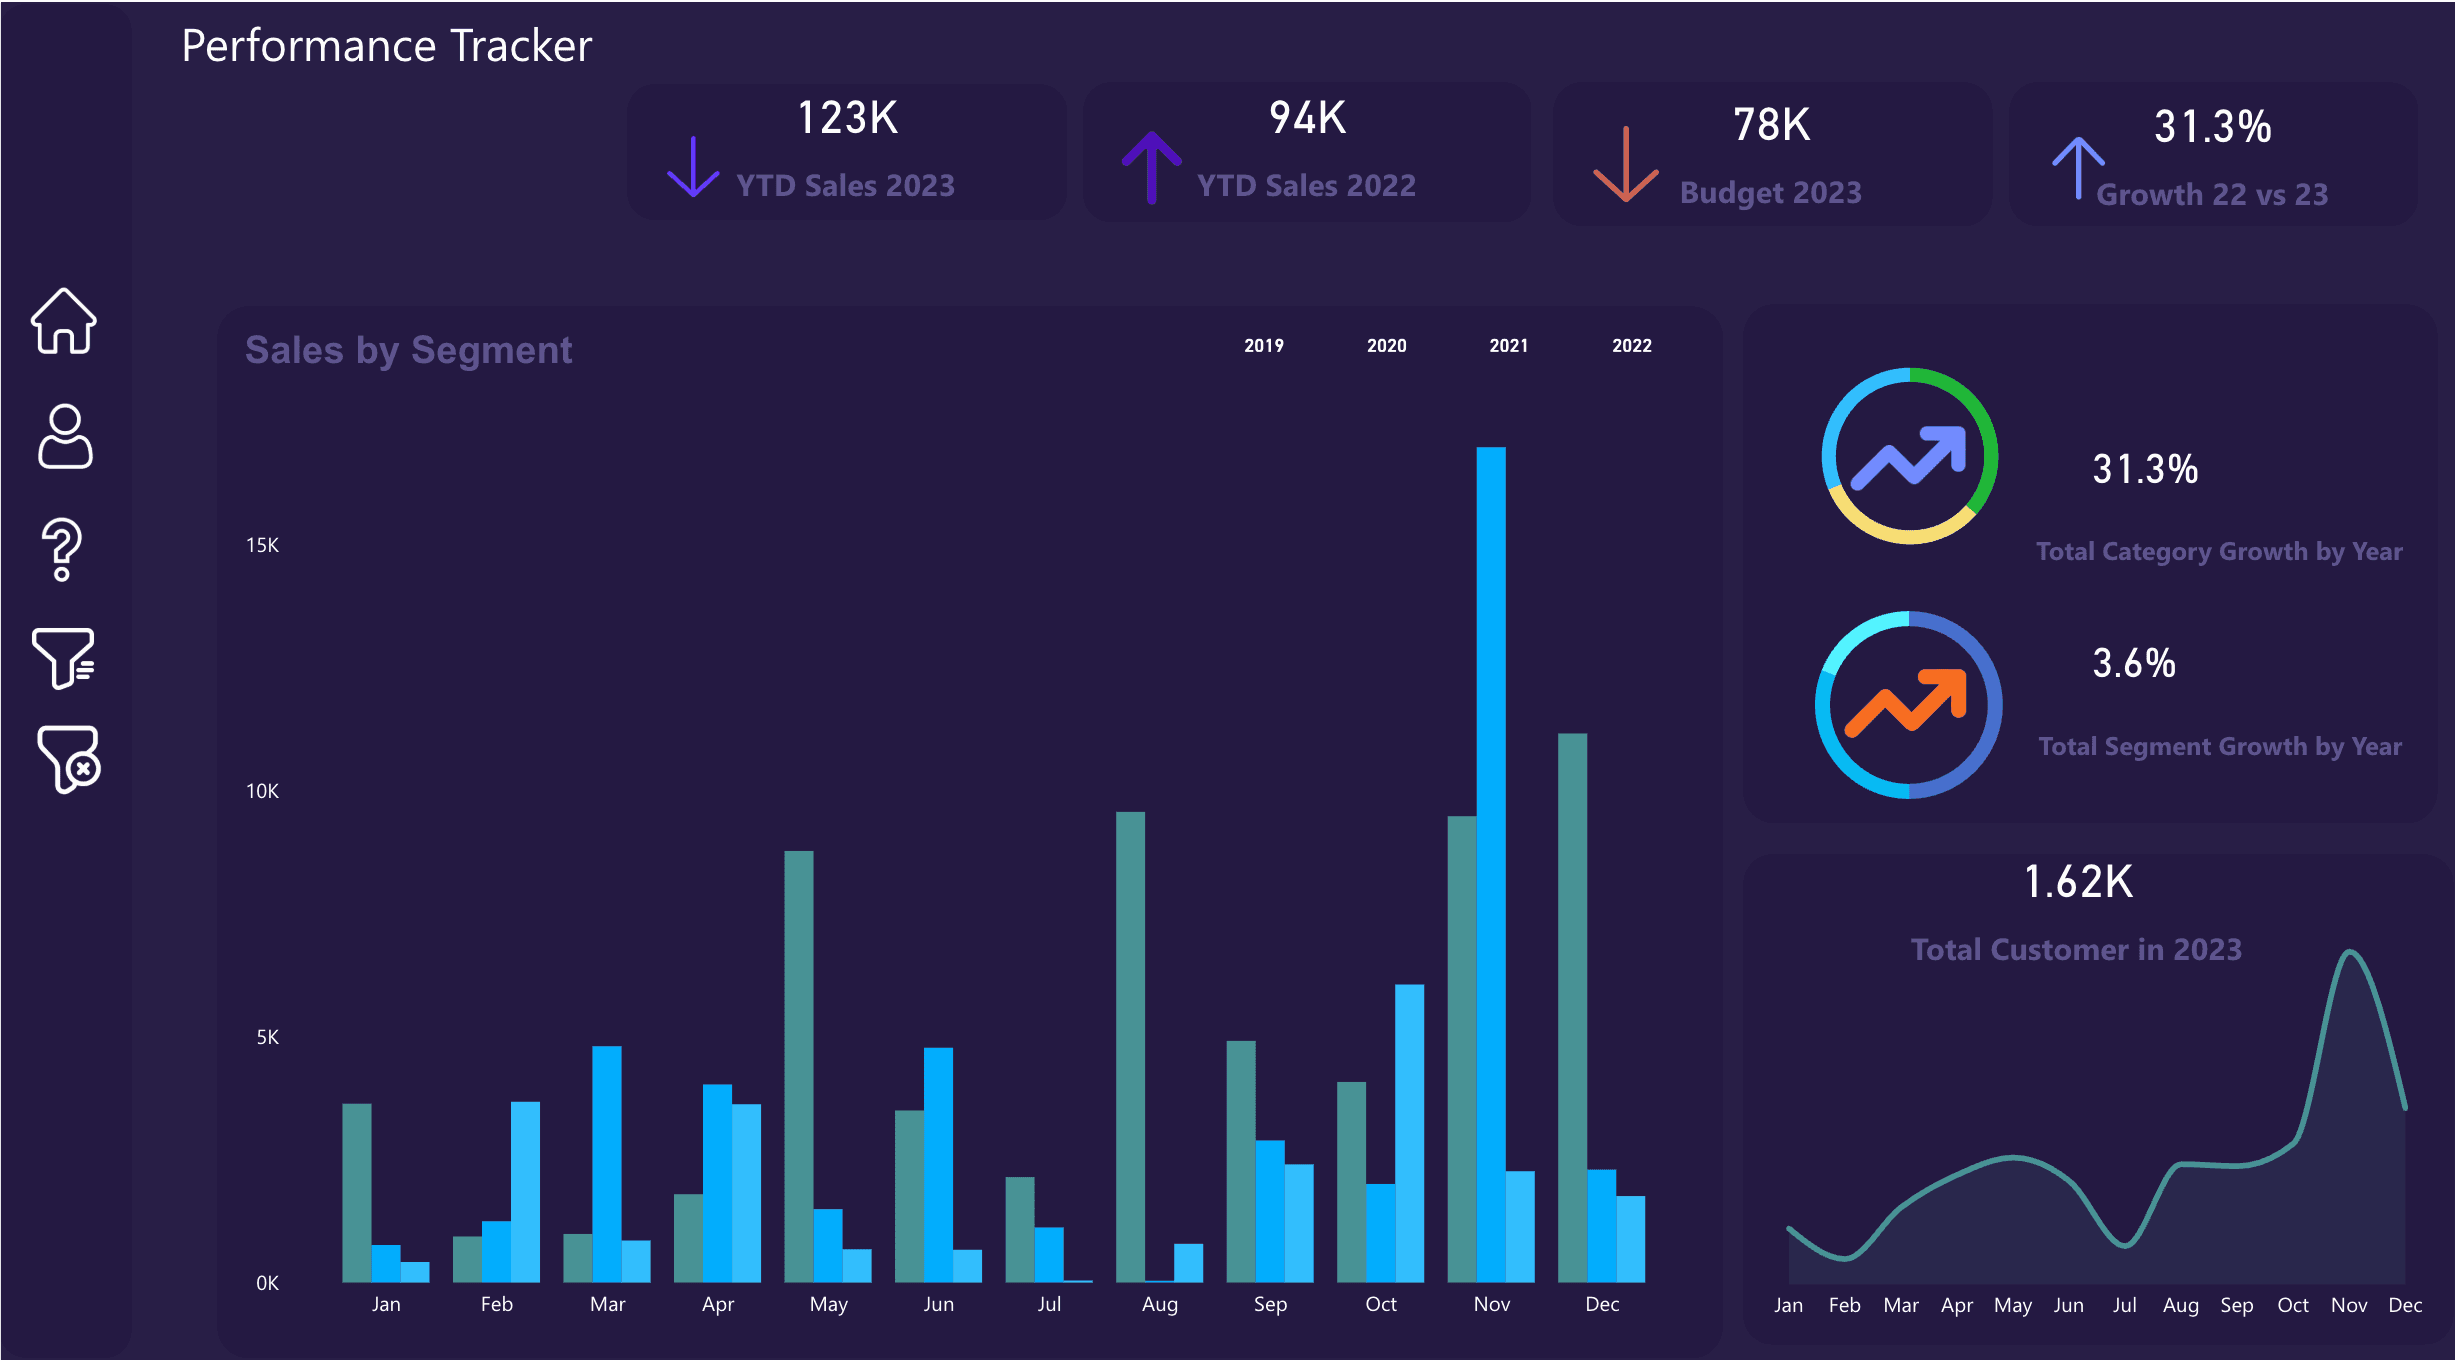
Drill-down performance pages for sales by segment, customer movement, budget comparison, and growth variance.
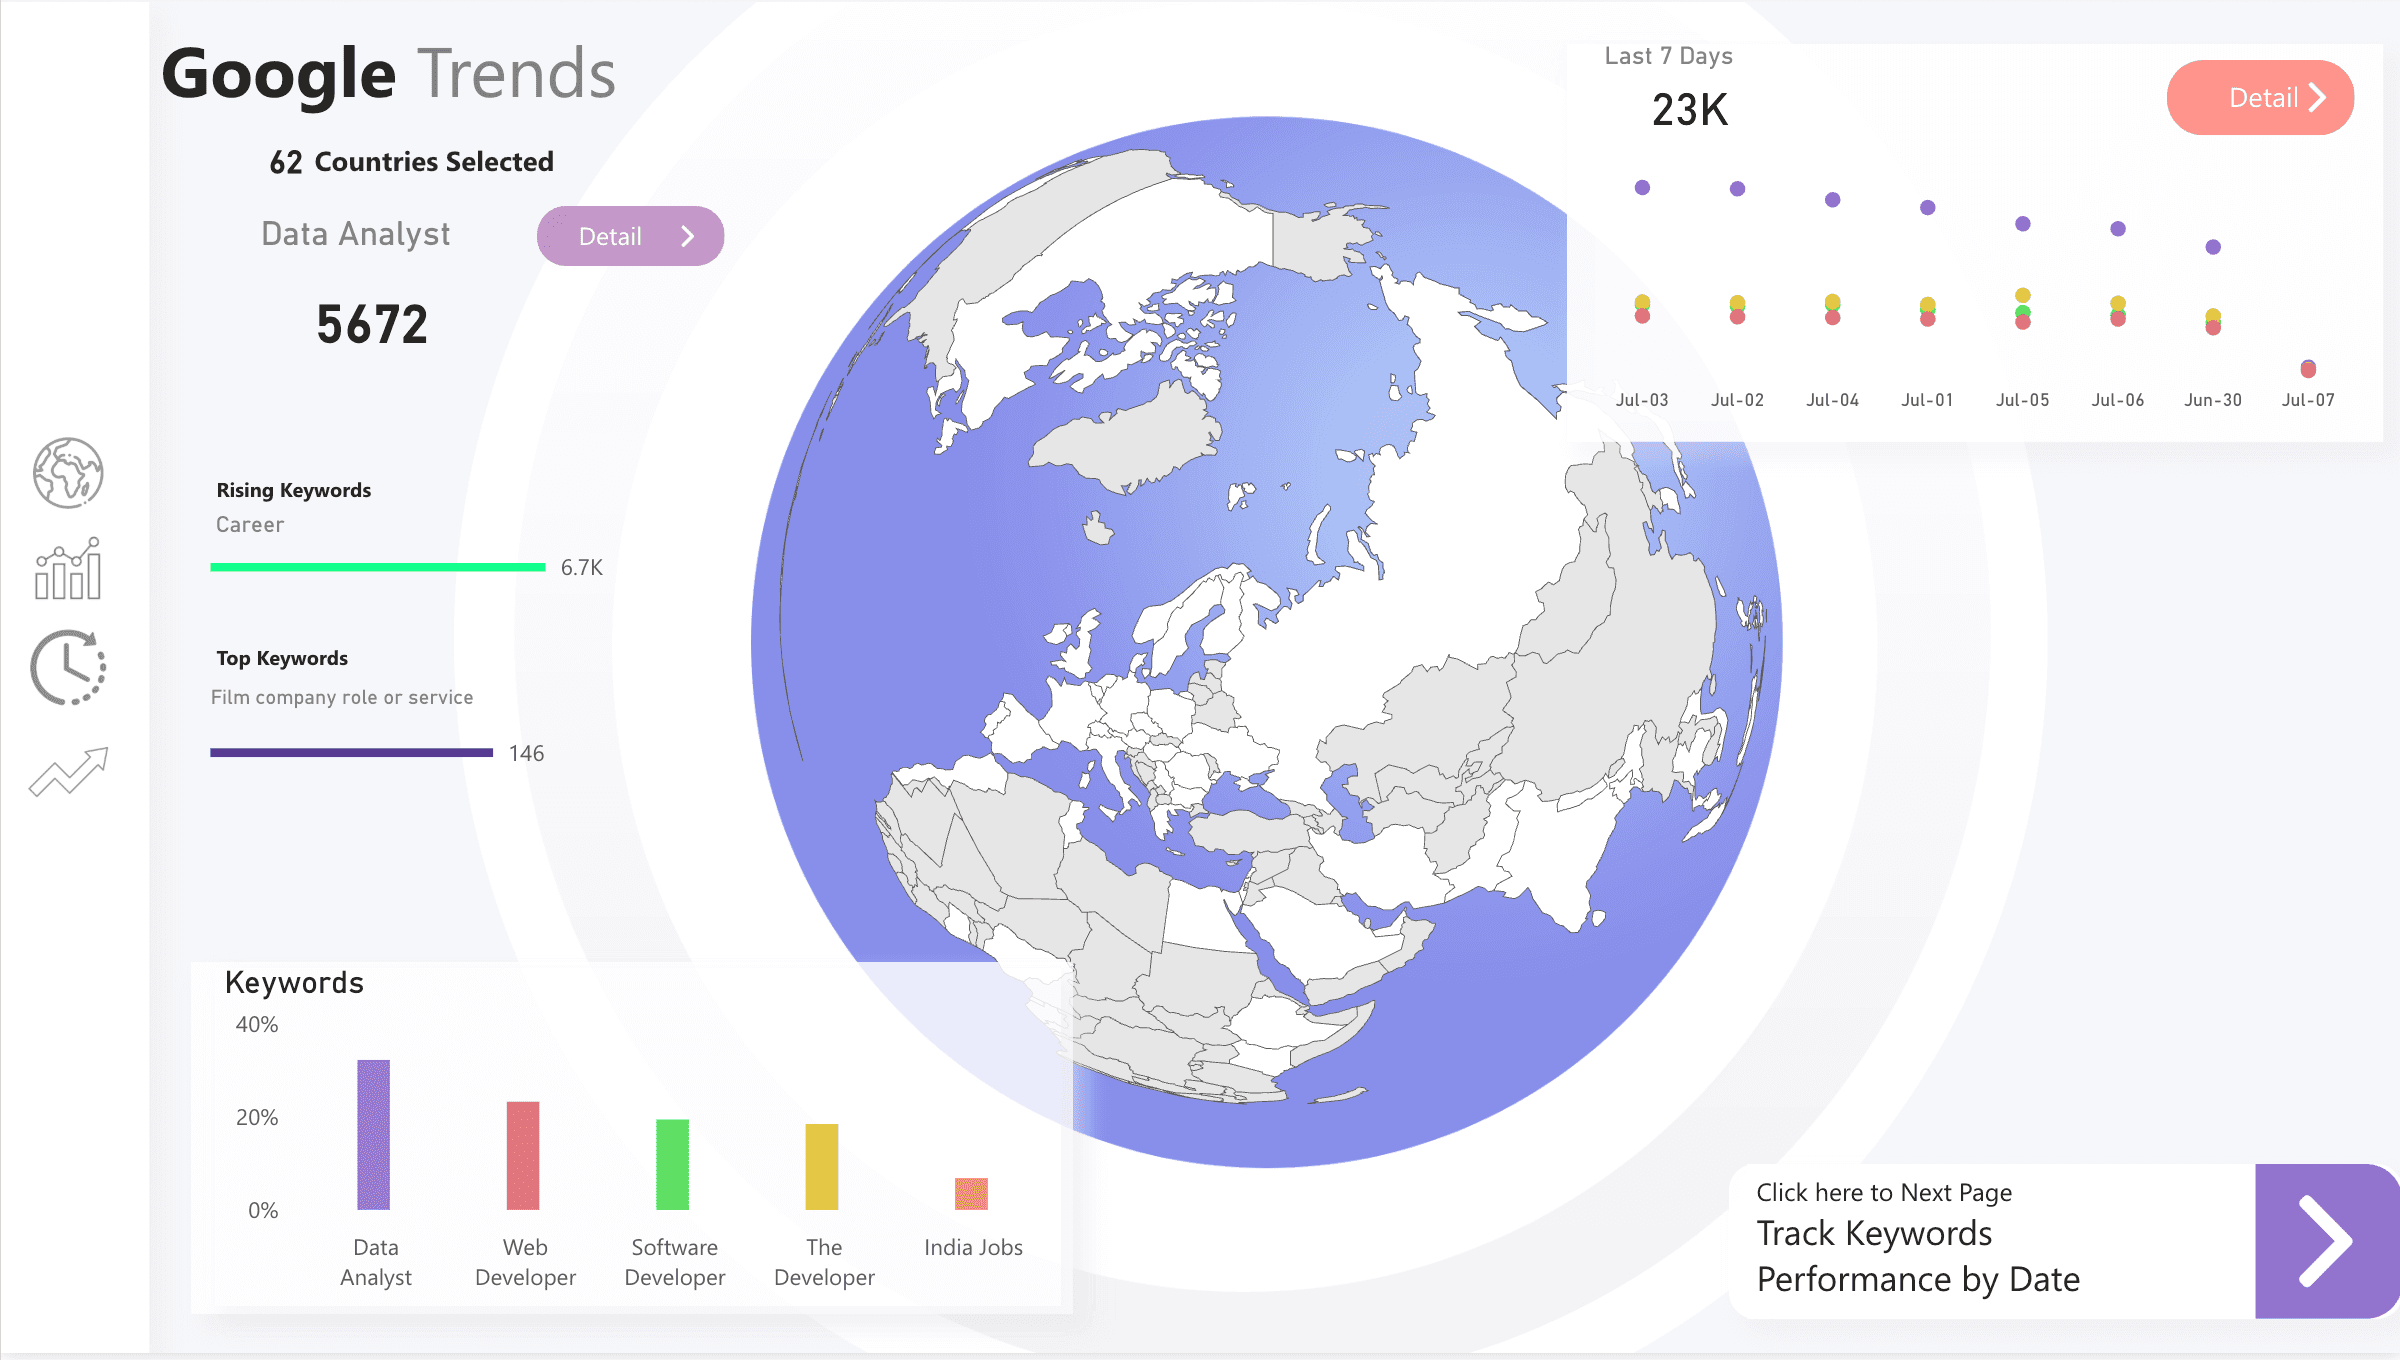
Geography, rankings, trend series, keyword comparisons, and guided navigation for market research.
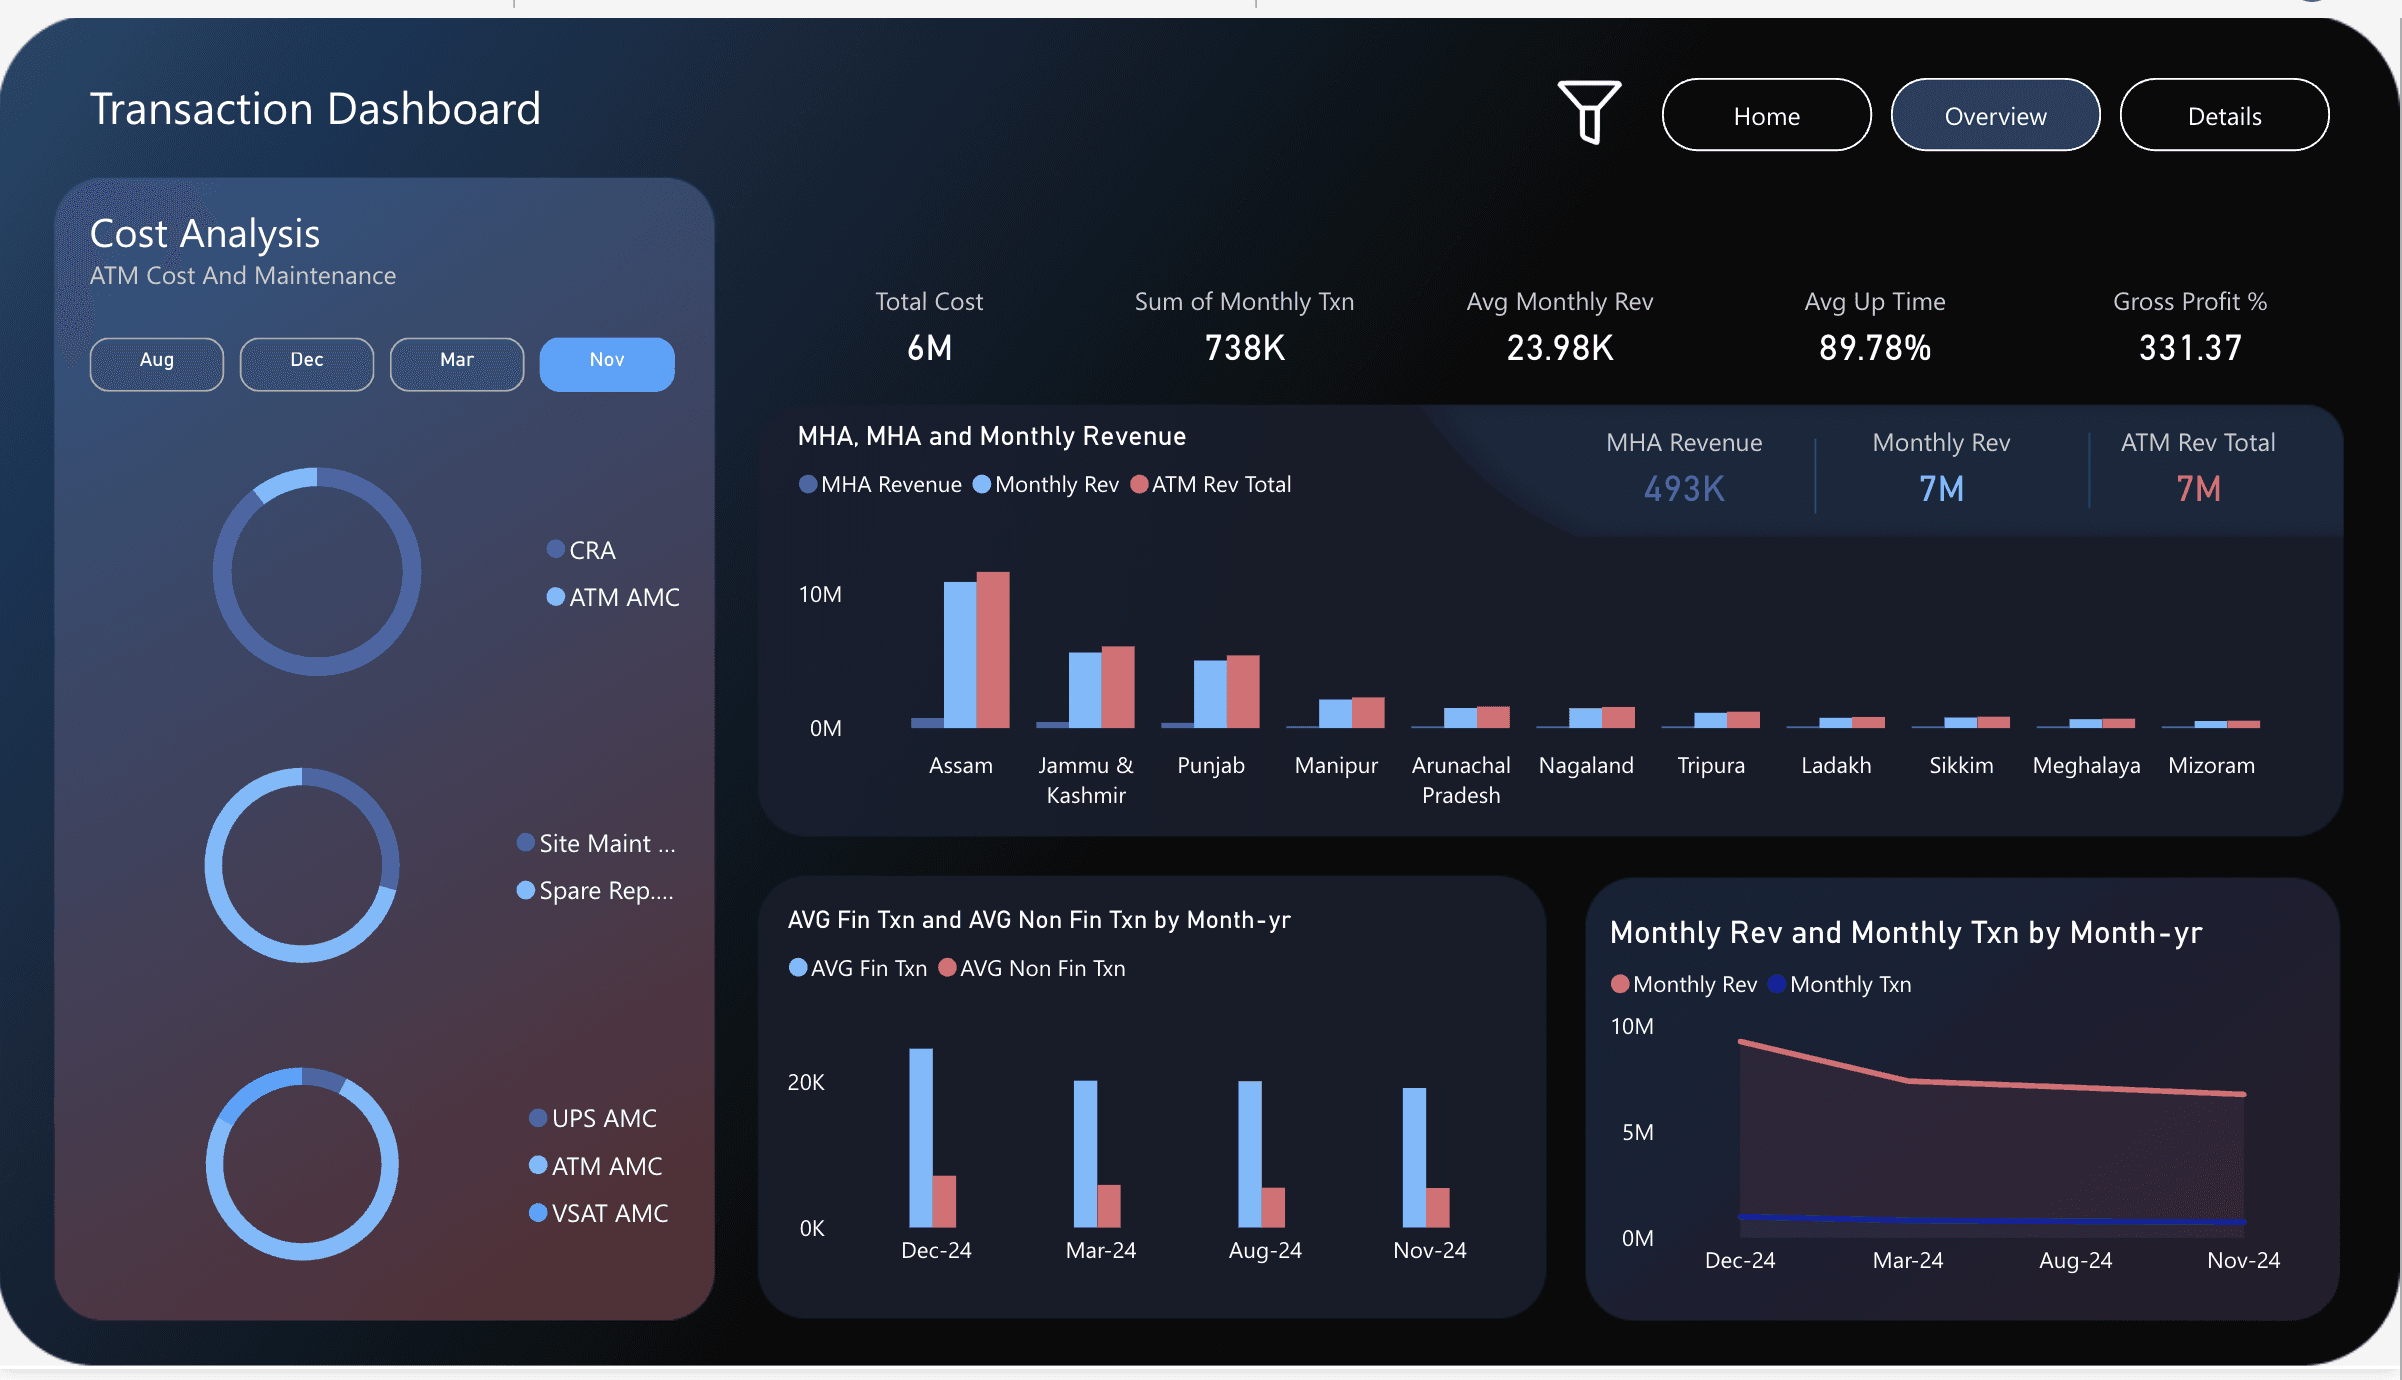
Transaction cost, maintenance, monthly revenue, uptime, gross profit, and regional performance analysis.
Implementation
I start with decisions, not visuals. Once the KPIs, data owners, and refresh rules are clear, the dashboard becomes the presentation layer of a system that can scale.
Discovery and KPI definition
Data source audit
Architecture design
Pipeline and model build
Dashboard design and testing
Deployment, training, and handover
Engagement Options
Best when you know reports are broken but do not know where the data problem starts.
Best when the data sources are known and you need a production-ready Power BI experience.
Best when you need the full foundation: ingestion, storage, model, governance, reports, and handover.
Ready to turn scattered data into trusted reporting?