Dashboard Audit
Review your current reports, KPI definitions, data quality issues, and refresh risks before building anything new.
Power BI dashboard consultant
Replace spreadsheet-heavy reporting with Power BI dashboards backed by clean data models, reusable DAX, automated refresh, and a handover your team can maintain.
Monthly reports take too long to prepare
Leadership does not trust the numbers
Excel files, SQL, and SaaS exports do not match
Power BI reports exist, but the model is messy
What you get
The work focuses on the parts that make reporting reliable: source mapping, data cleaning, semantic modeling, DAX, dashboard UX, refresh, access, and handover.
Review your current reports, KPI definitions, data quality issues, and refresh risks before building anything new.
Create the relationships, calendar tables, DAX measures, hierarchies, and business definitions your reports depend on.
Design executive, finance, operations, and drill-through pages that support real decisions instead of decorative charts.
Set up refresh, workspace sharing, row-level security where needed, documentation, and a practical handover process.
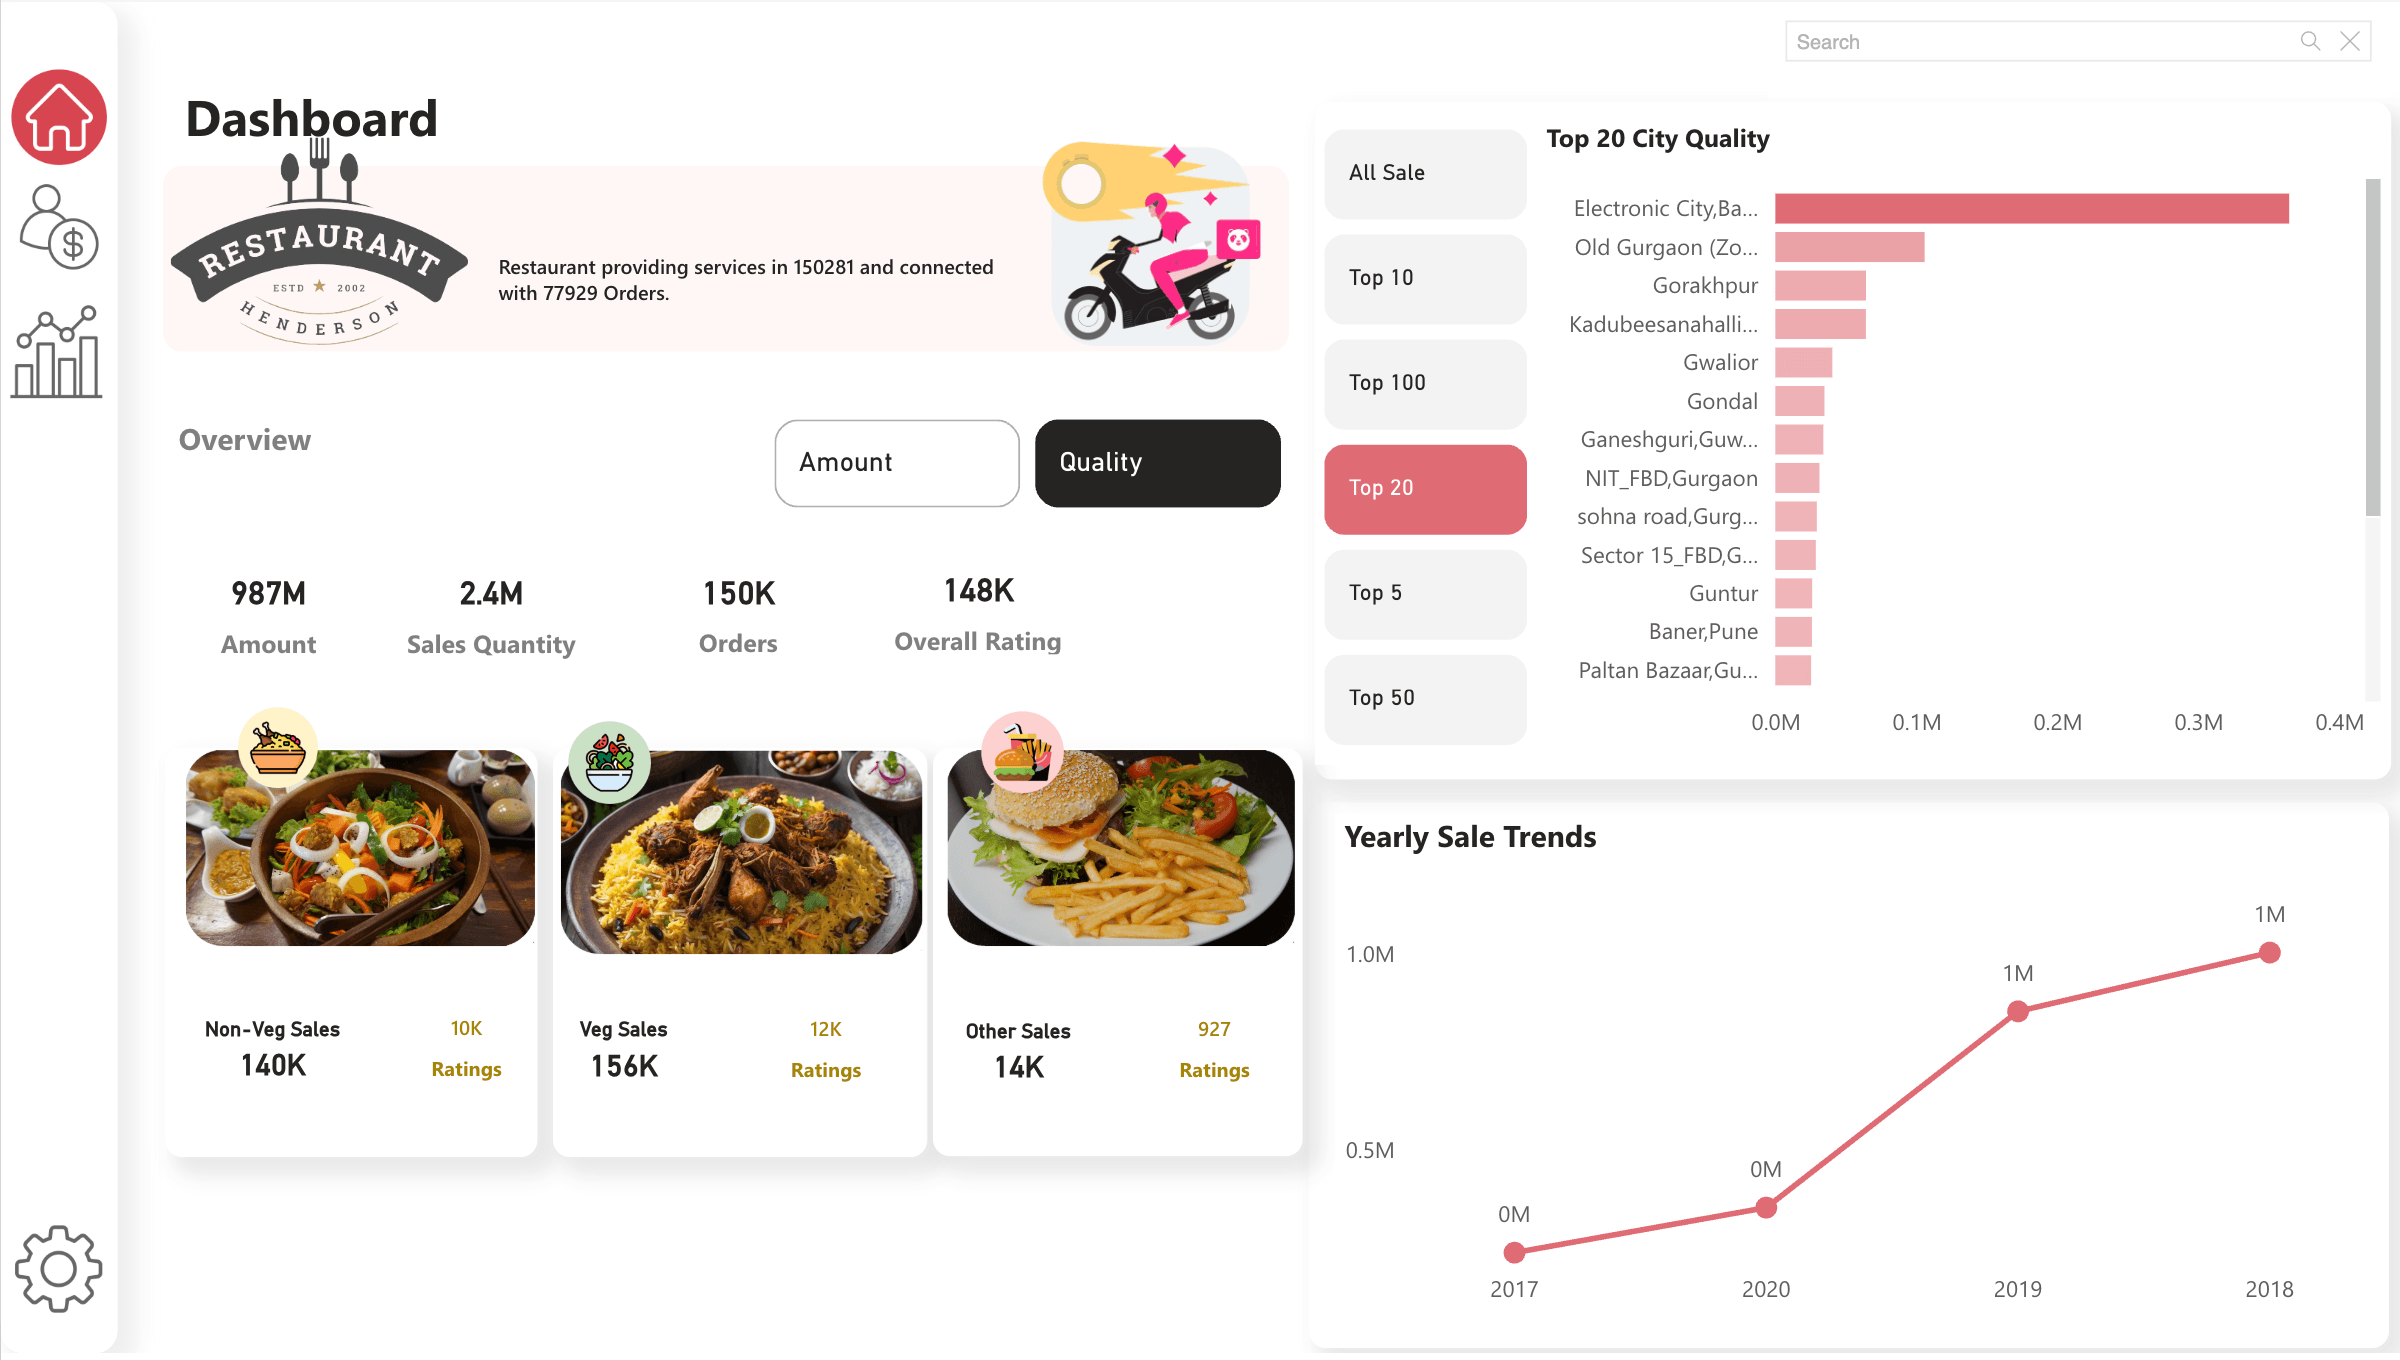
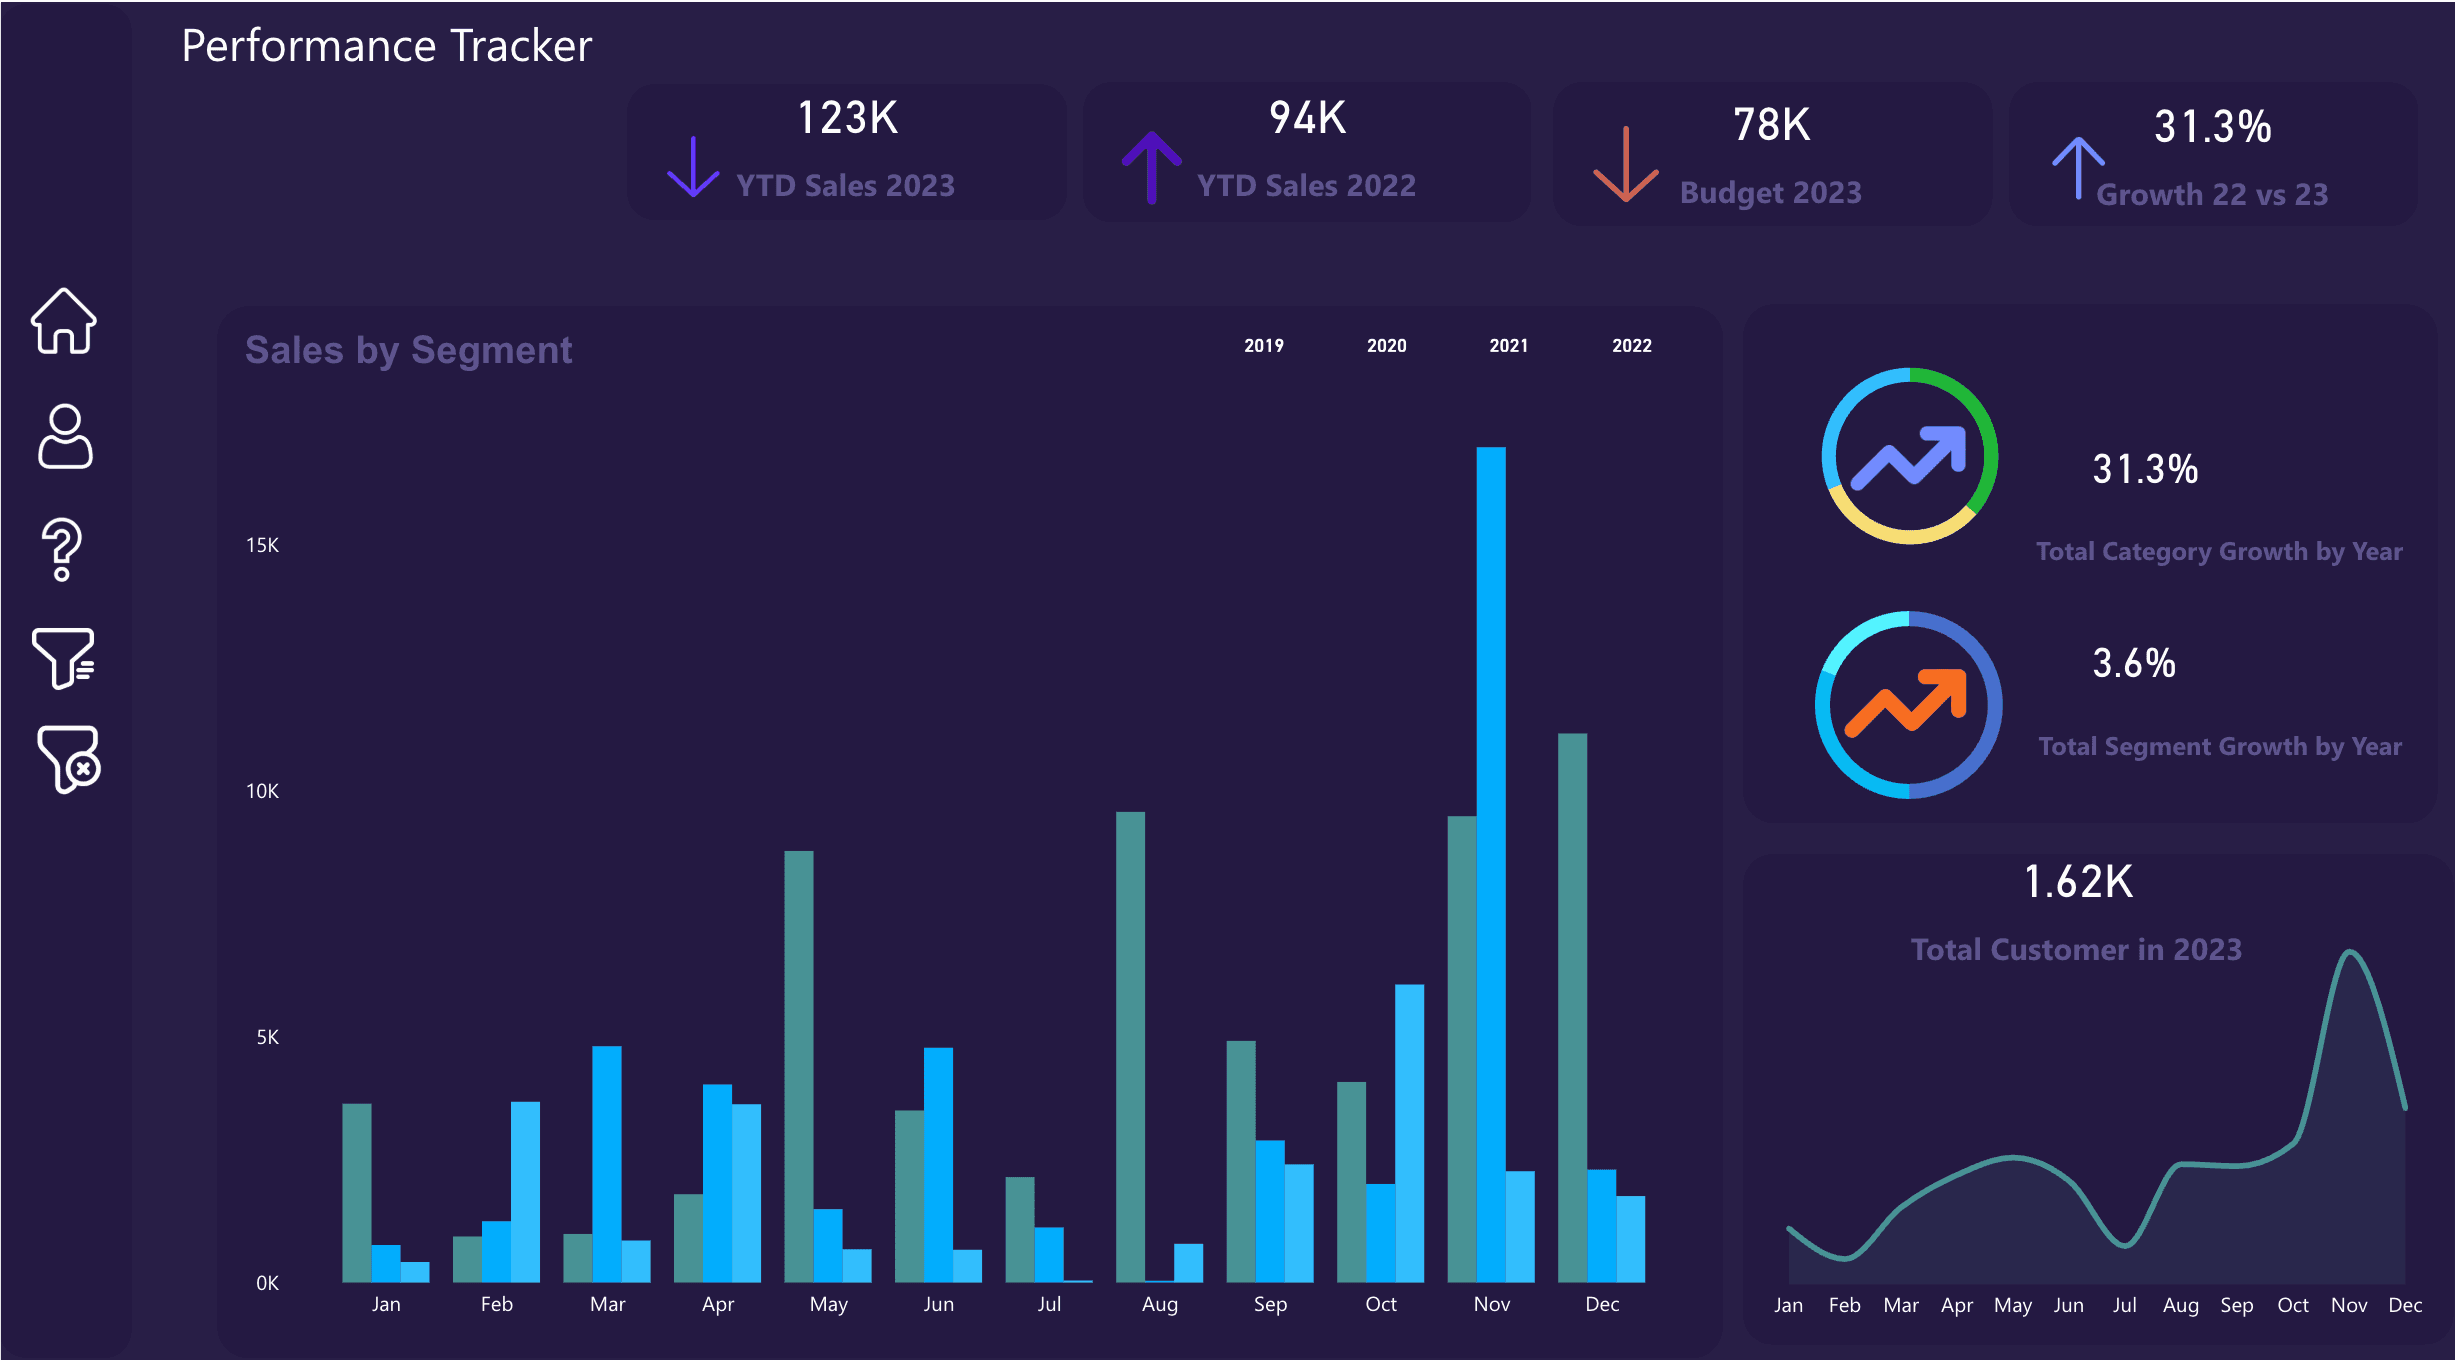
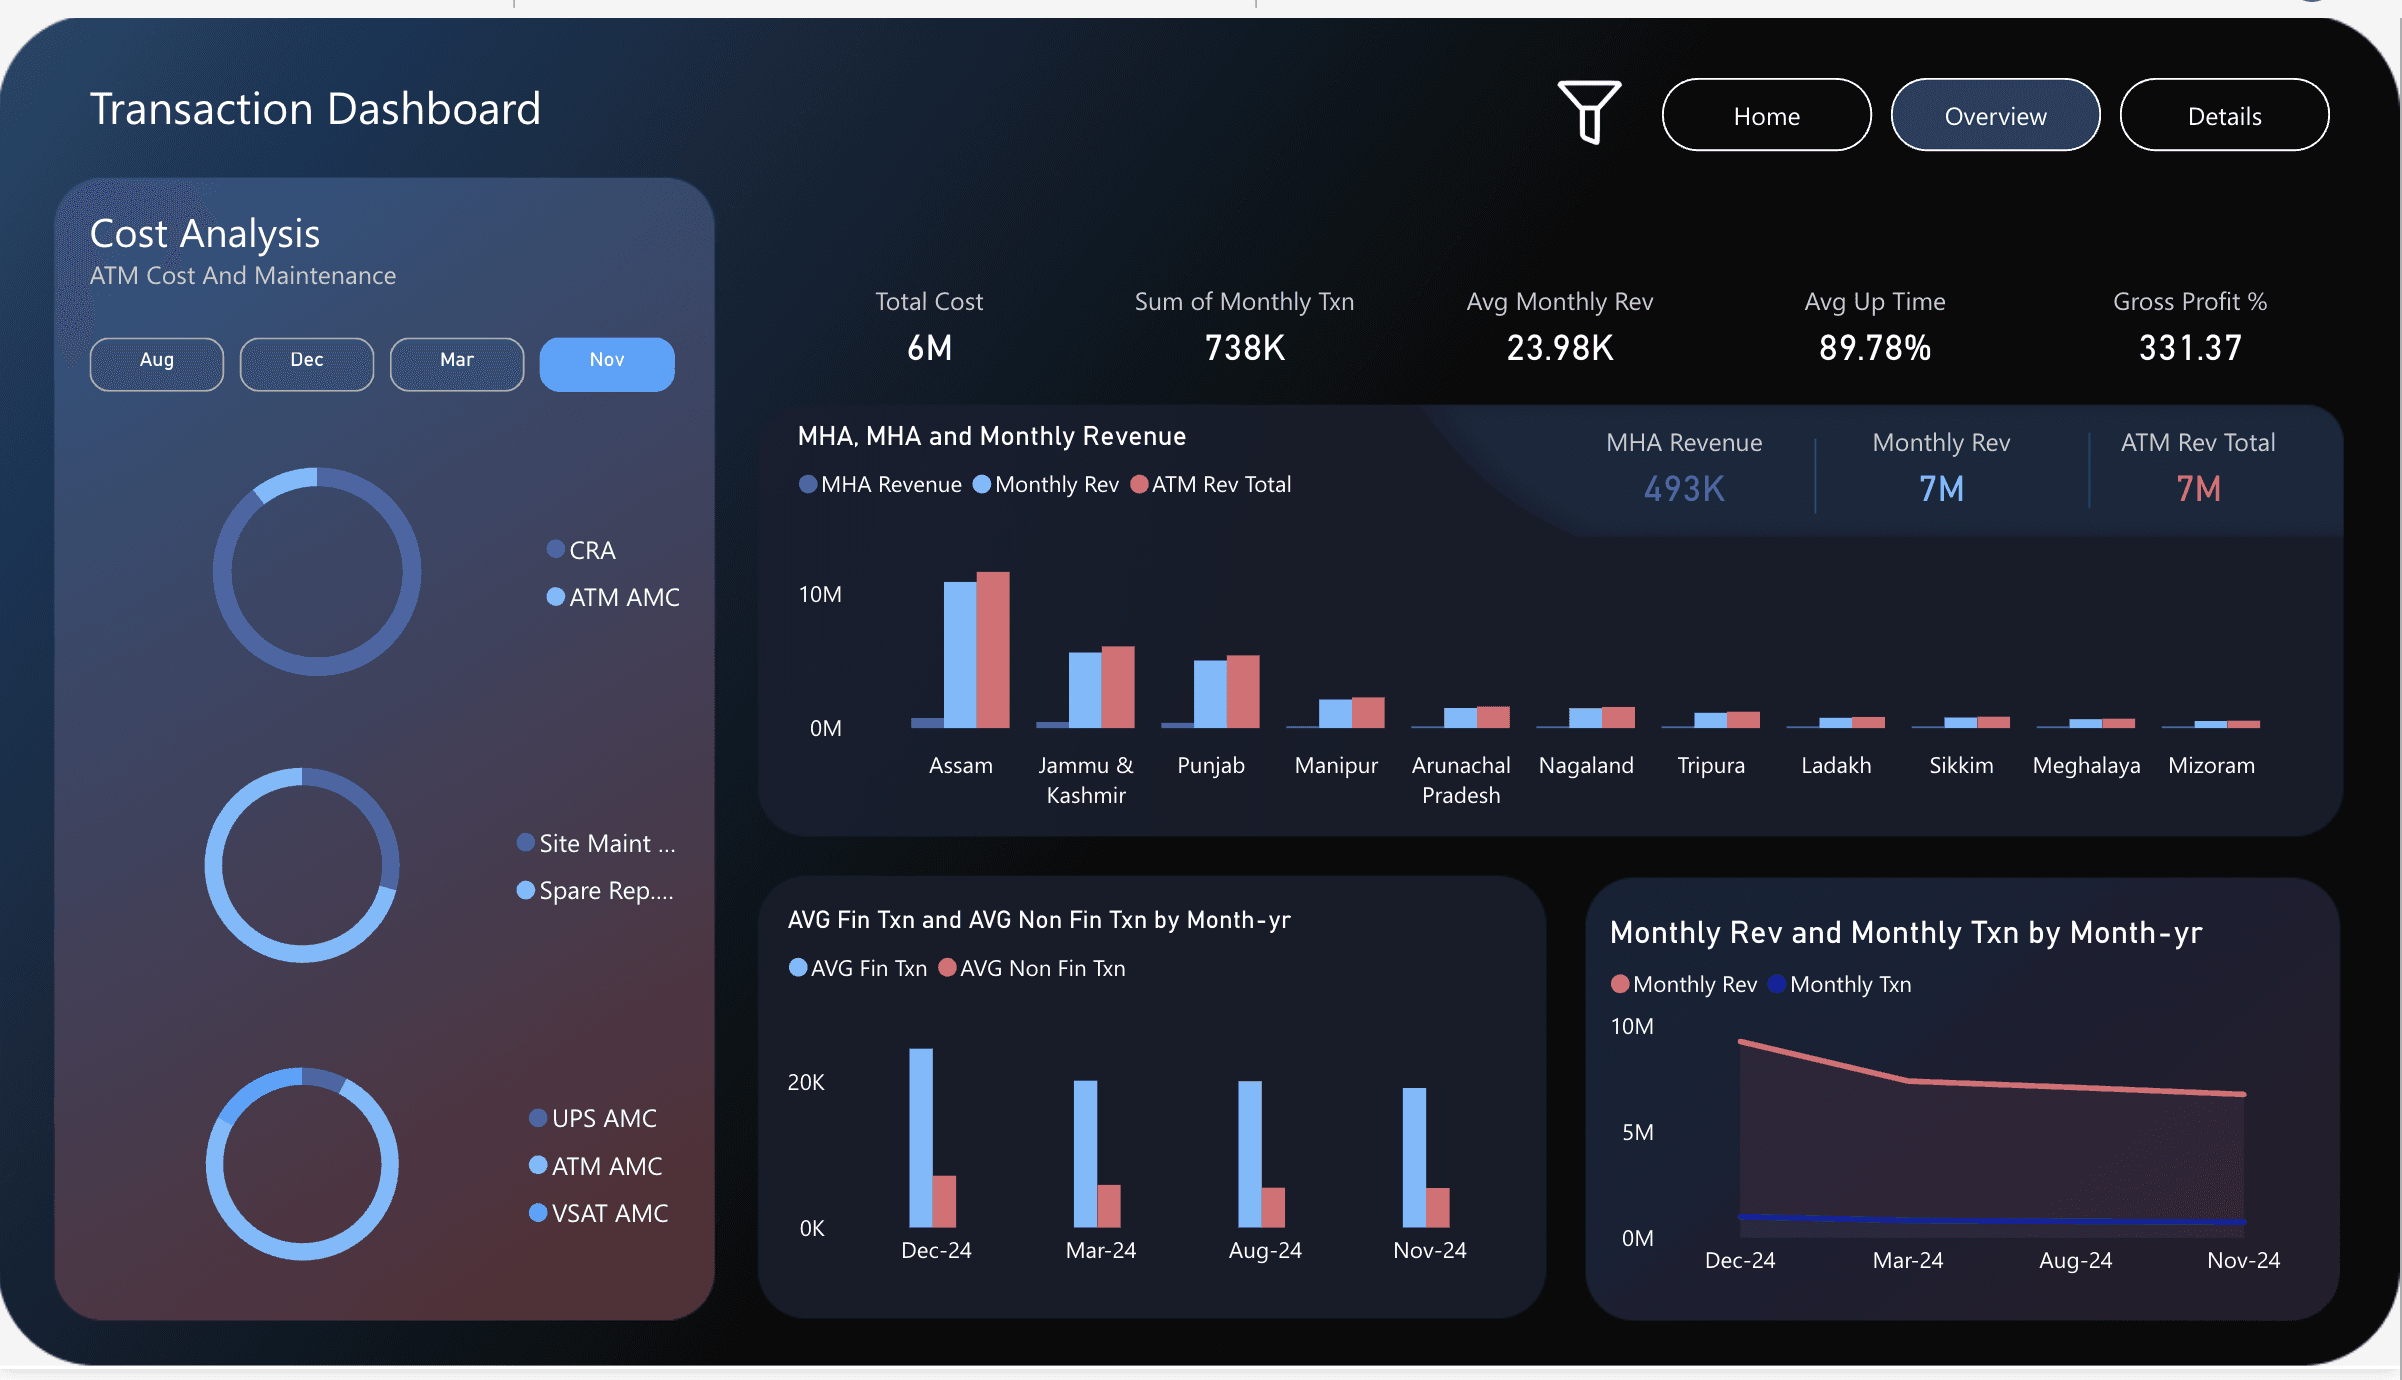
Dashboard examples
The same build process can support revenue reporting, cost analysis, operations tracking, market intelligence, and executive scorecards.
Send the brief and I will recommend the right next step: audit, model repair, dashboard build, or full data architecture.