KPI definitions your team agrees on
Power BI consulting for decision-ready reporting
Build dashboards your team can actually trust.
I help businesses turn Excel files, SQL databases, APIs, SharePoint lists, and SaaS exports into a reliable Microsoft data stack with Power BI reports, refresh, governance, and handover.
Power BIMicrosoft FabricSQL and Azure SQLDAX and semantic models
5+ yrsPower BI and business intelligence delivery
End-to-endSources, model, dashboard, security, refresh
RemoteAvailable for Kenya, US, UK, and global teams
30 minStart with a focused discovery call
What the service fixes
Most dashboard problems start before the chart.
A dashboard can look polished and still fail if the data is manually exported, KPIs are undefined, tables are not modeled correctly, or nobody owns the refresh process. This service builds the reporting foundation first, then the dashboard.
Power BI dashboards connected to real sources
Clean semantic model with reusable DAX
Refresh, security, and handover ready for production
Report examples
Dashboards for operations, finance, and leadership.
These examples show the kind of reporting this service supports: executive KPIs, operational cost analysis, trend intelligence, and drill-down views.
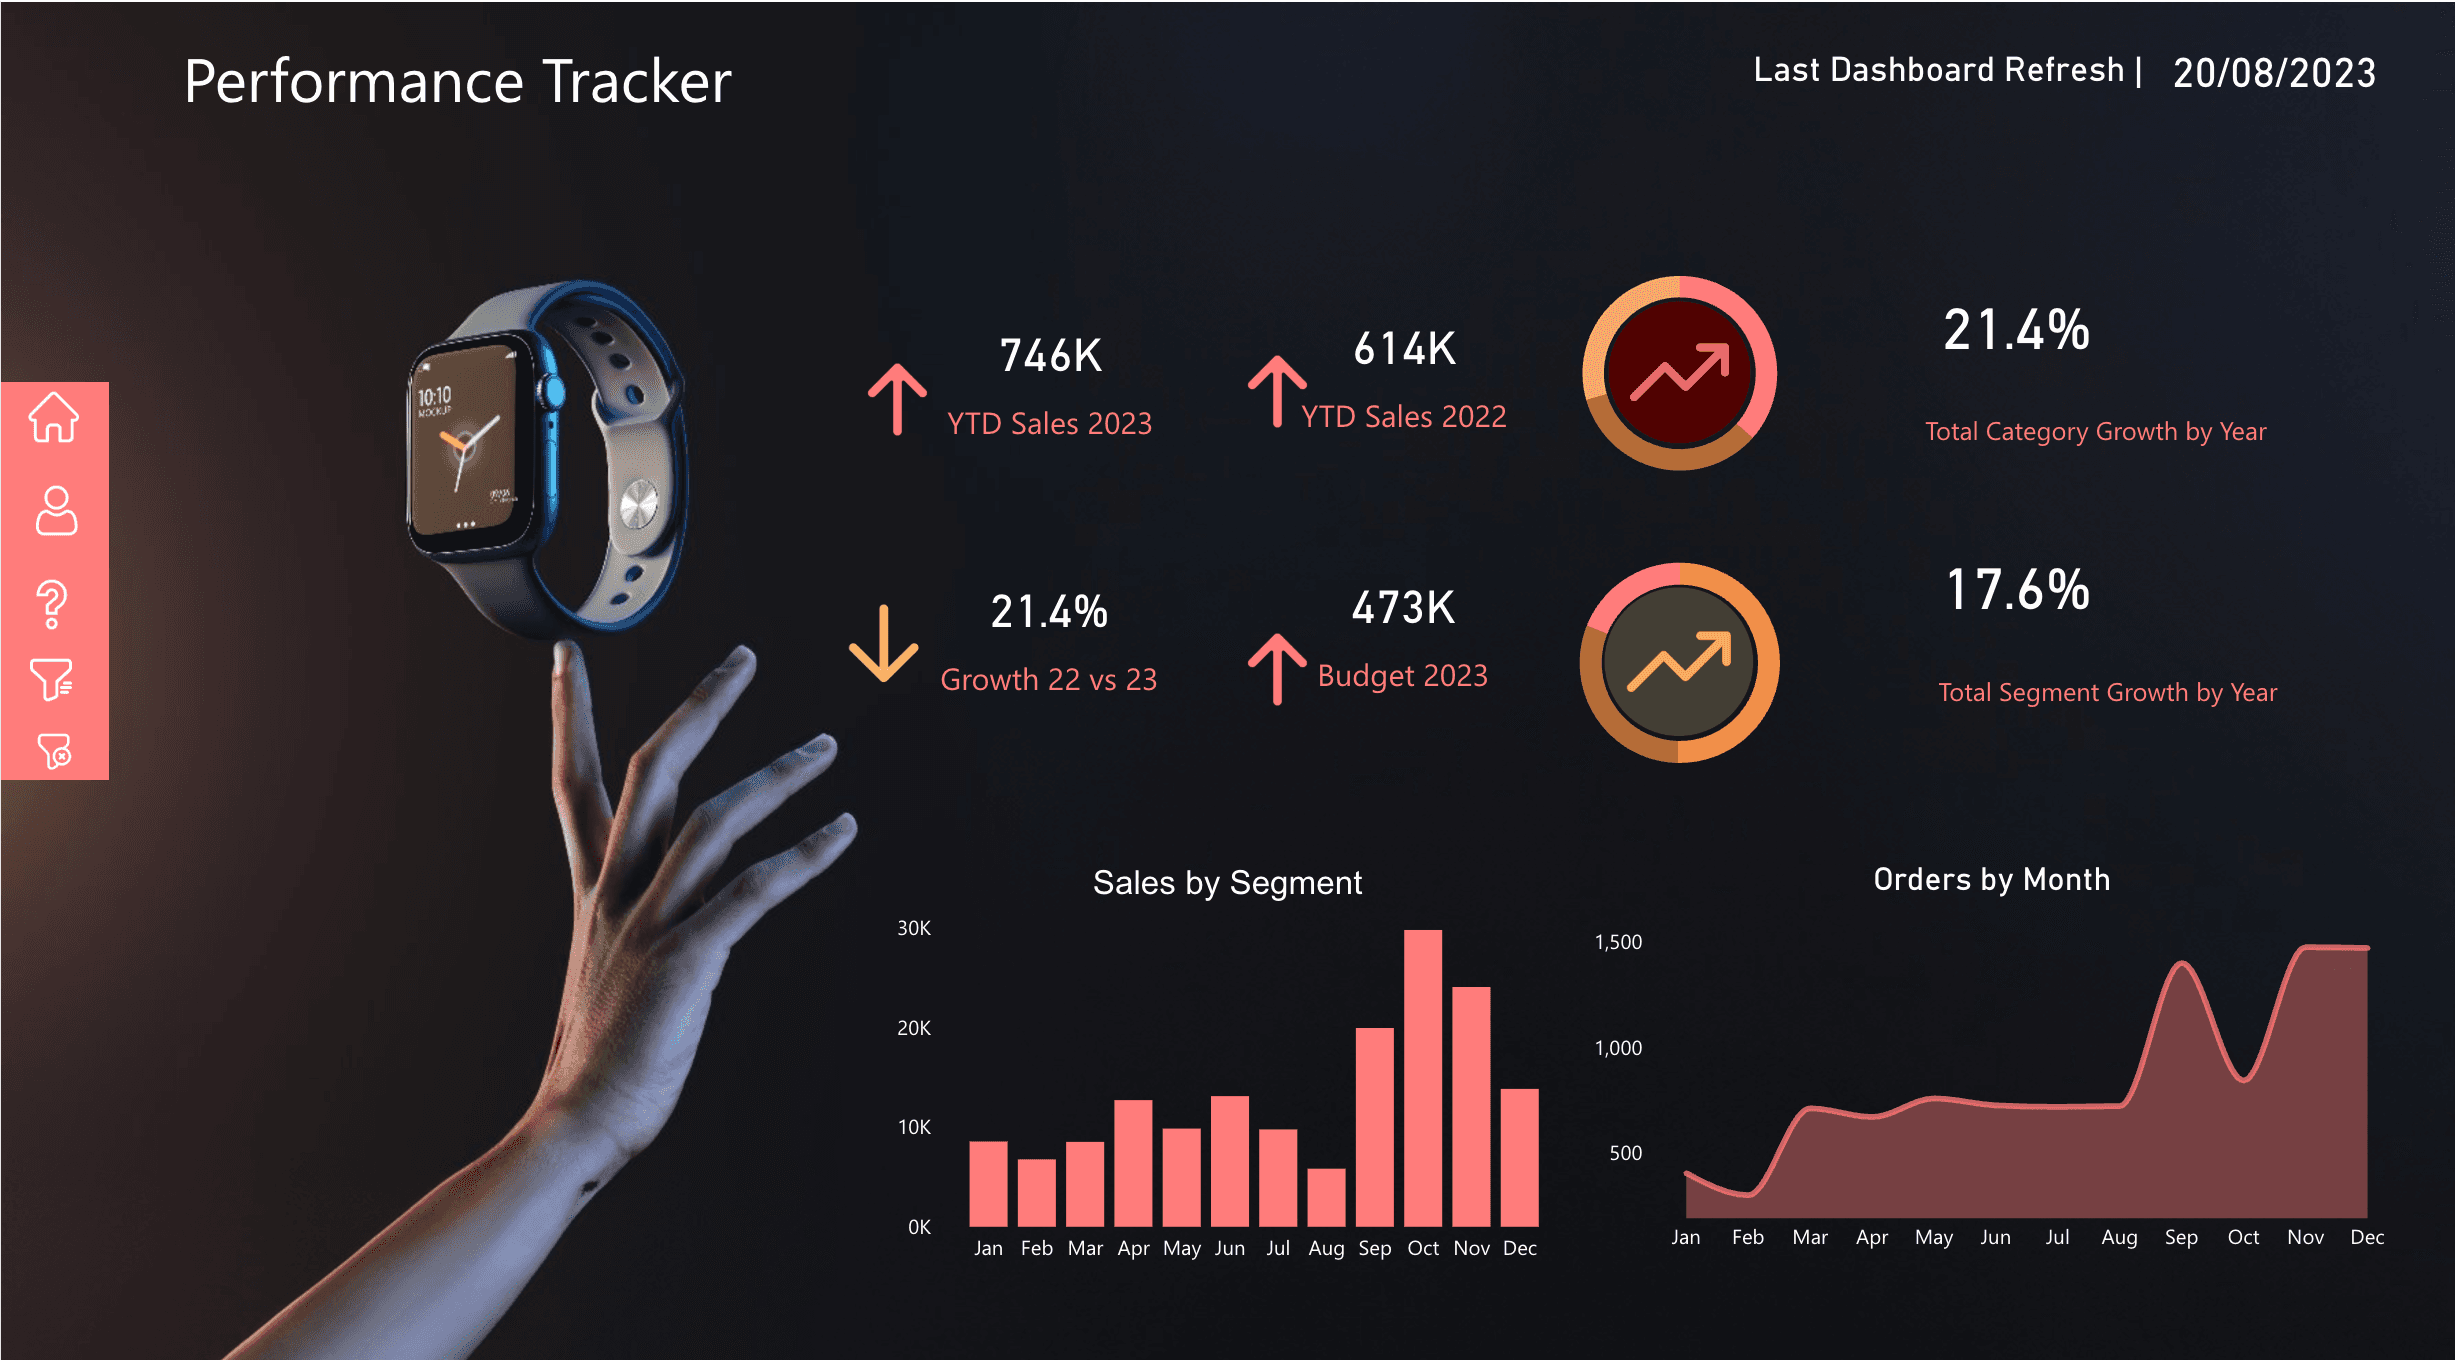
Executive Performance
Budget, growth, YTD sales, orders, segment mix, and last-refresh status for leadership review.
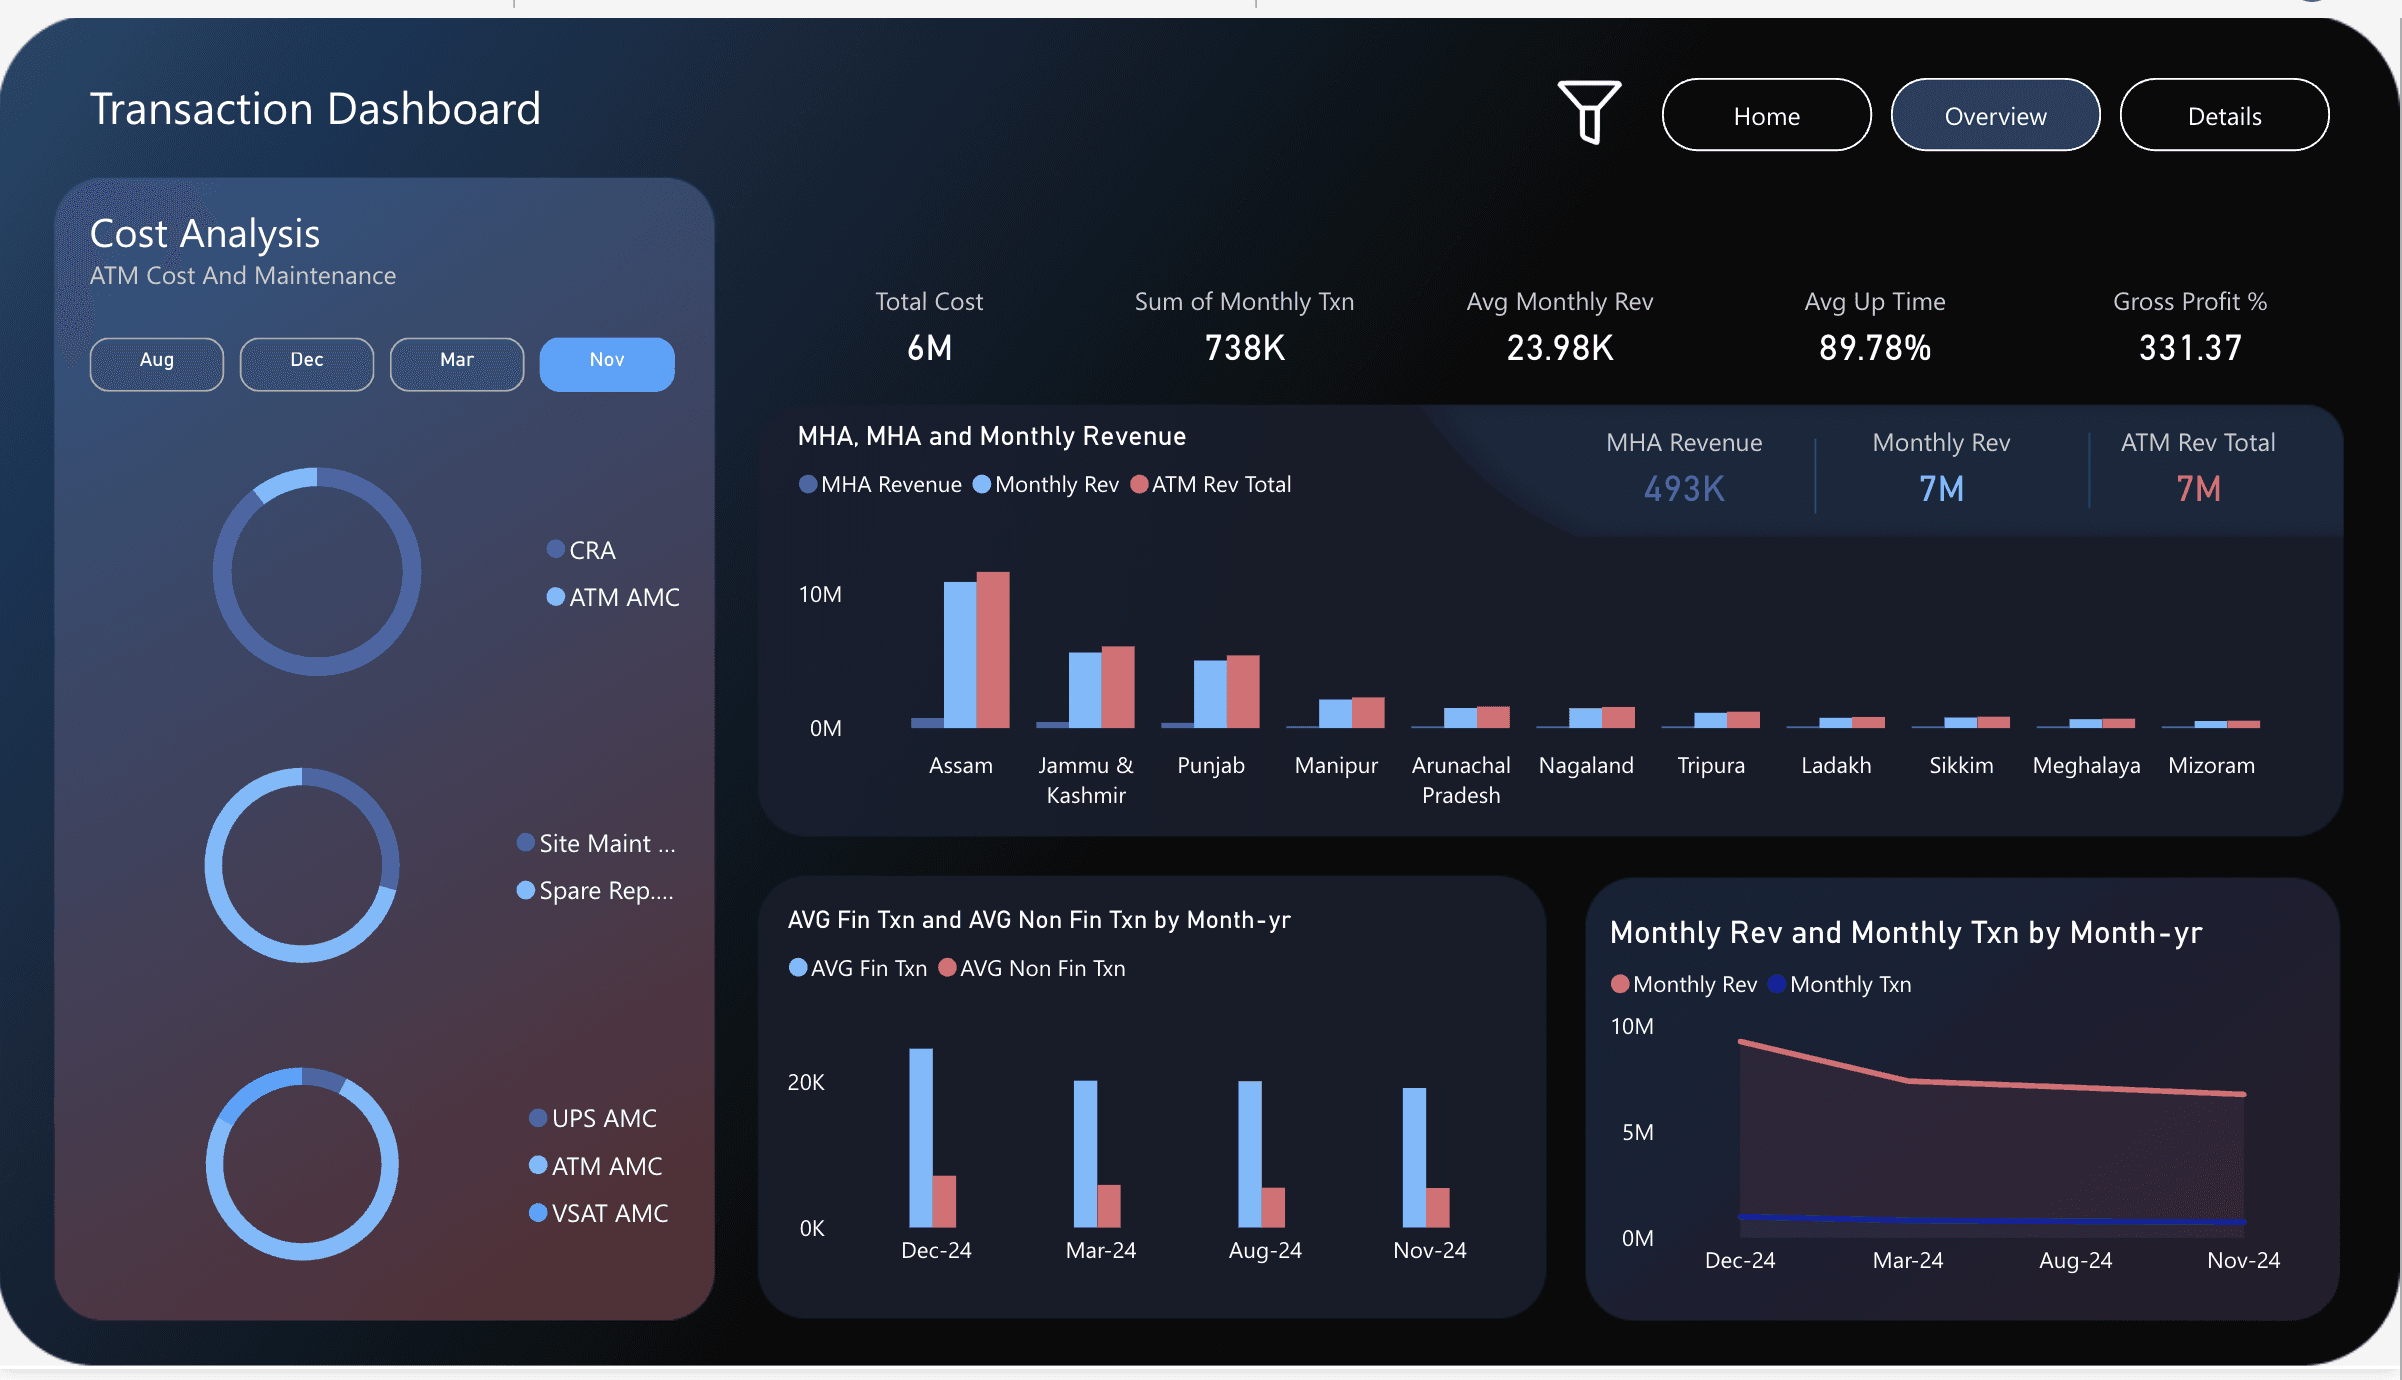
Operations & Cost
Revenue, uptime, maintenance cost, transaction volumes, region performance, and profitability.
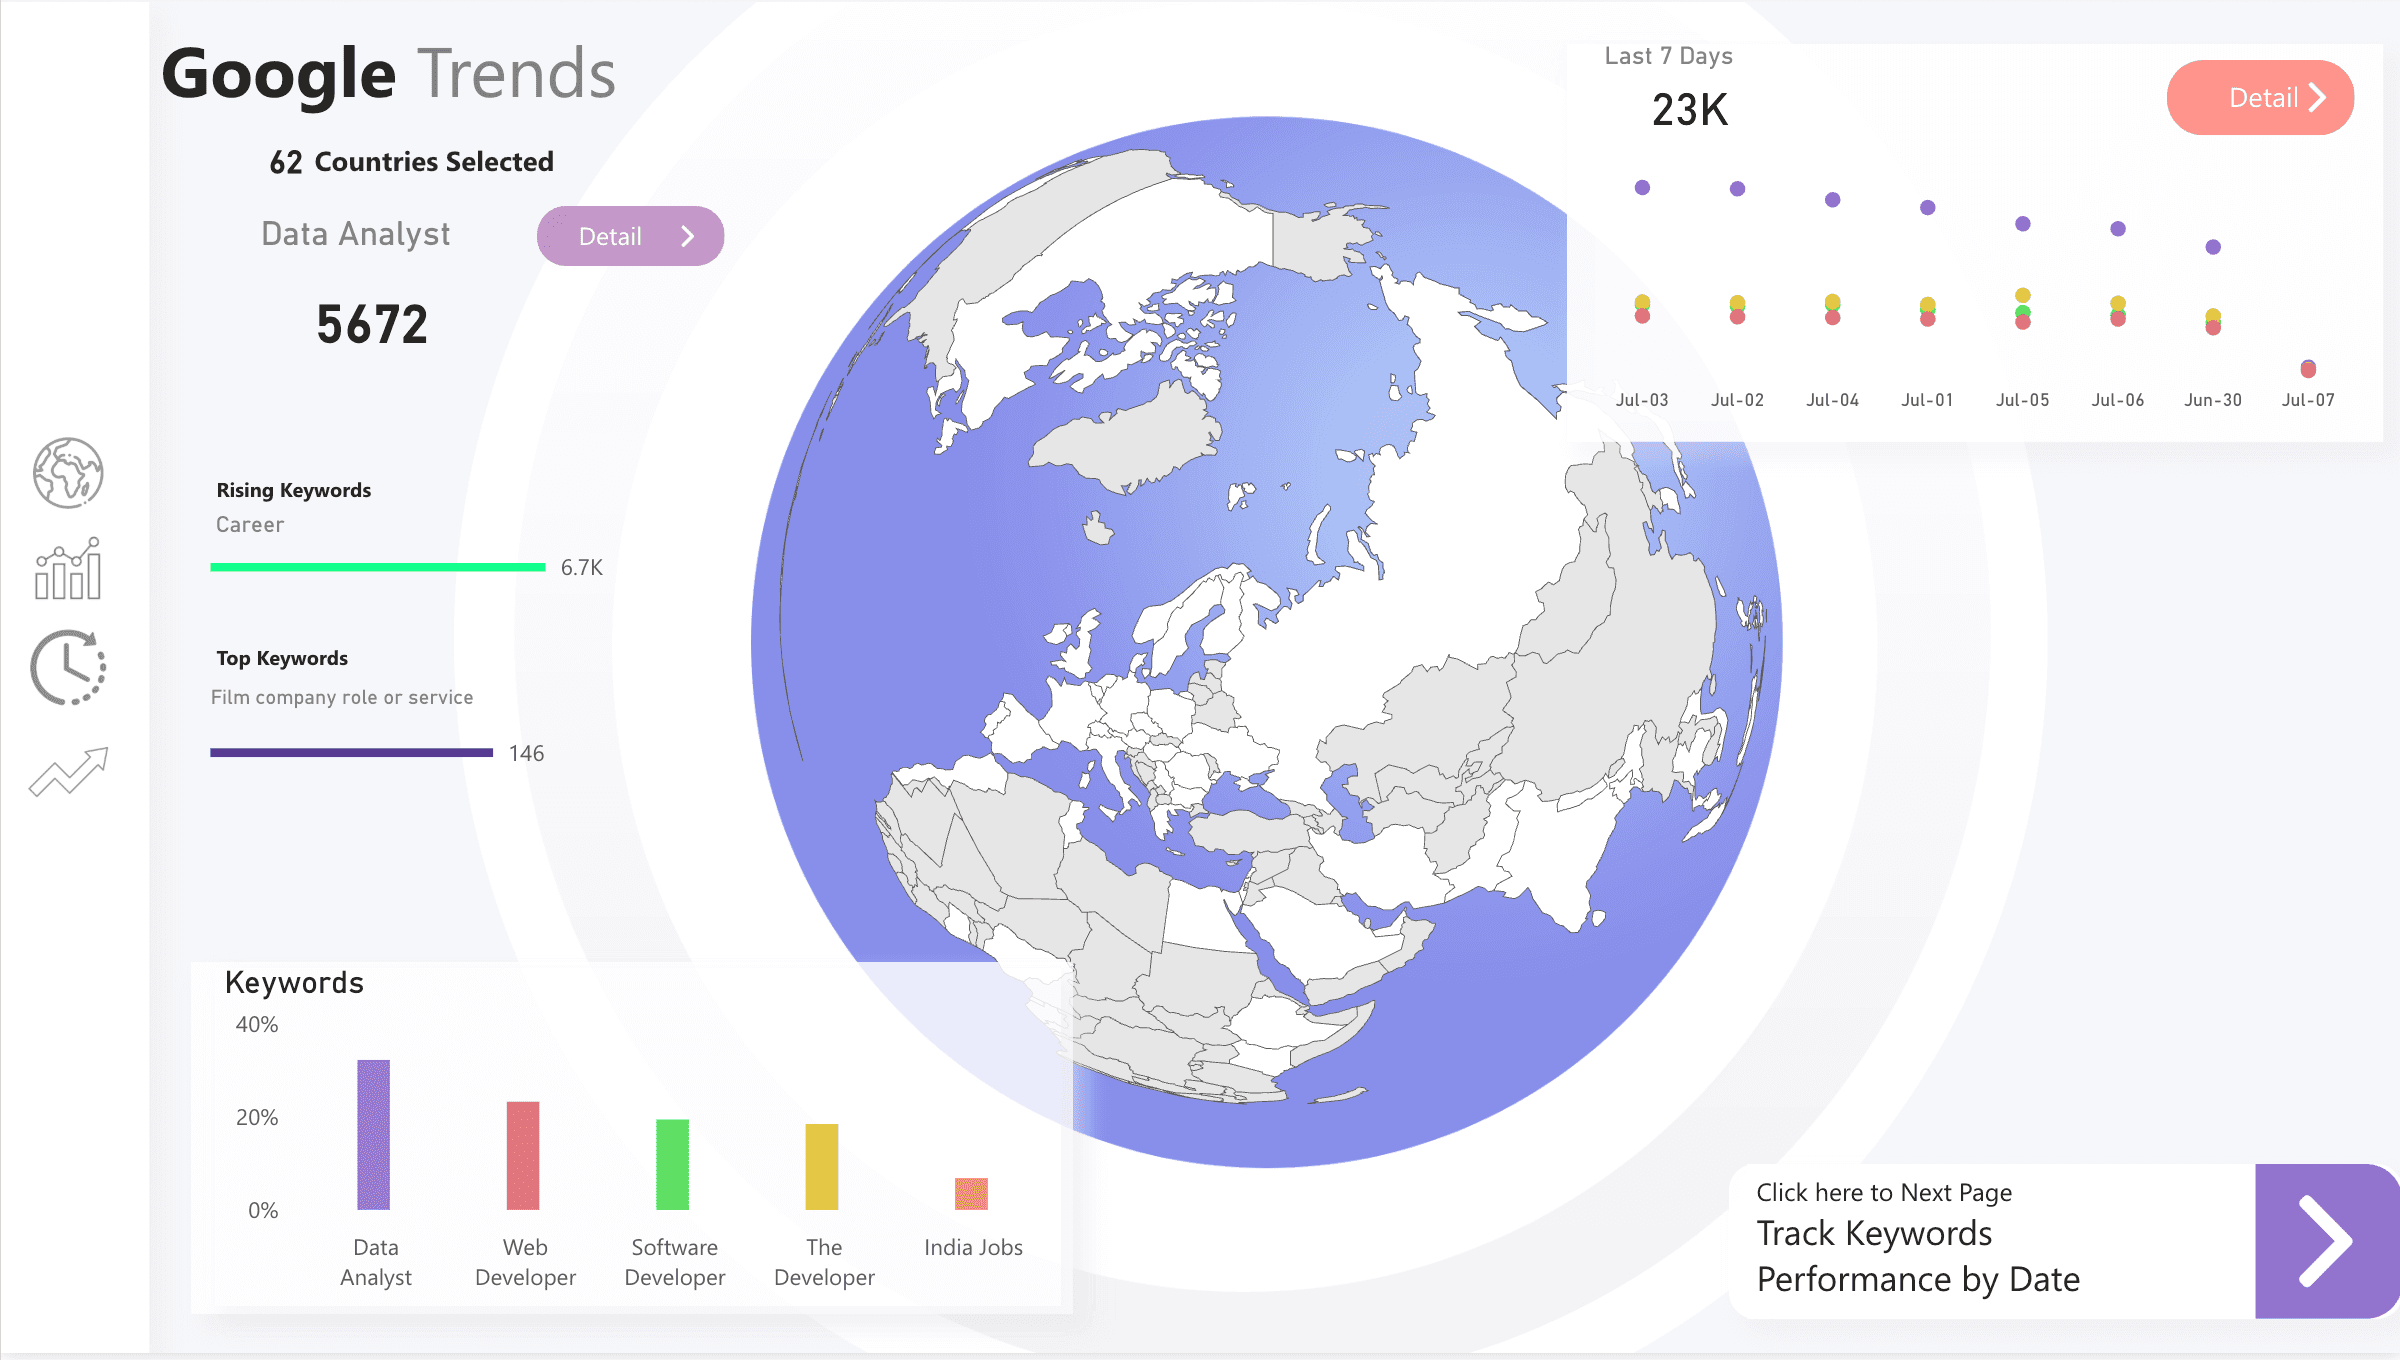
Market Intelligence
Trend comparisons, geography, ranking tables, keyword movement, and research dashboards.
Engagement options
Start small or build the full data stack.
If you are running ads to solve a specific reporting pain, the easiest entry point is a data audit. If the data sources are already clear, we can move directly into the dashboard or architecture build.
Data Audit
You have reports, but the numbers are not trusted.
Source inventoryKPI mapData quality risksArchitecture recommendation
Dashboard Build
You know the data sources and need a usable Power BI report.
Power Query cleanupSemantic modelDAX measuresPublished dashboard
Complete Data Stack
You need the foundation behind reporting, not just visuals.
Fabric or SQL designPipelinesSecurityRefresh and handover
Book the audit
Tell me what reporting problem you need solved.
Send a short brief and I will reply with the best next step: audit, dashboard build, semantic model repair, or full Microsoft data architecture.
01
We map the business decisions and KPIs first.
02
We audit the source systems, refresh paths, and data quality risks.
03
We design the Microsoft data stack: Power BI, Fabric, SQL, Azure SQL, or hybrid.
04
We build the model, dashboards, security, documentation, and handover process.
Prefer direct contact? Email boniface@muchendu.com or use WhatsApp from the floating button.
Need more depth first? Read the full Power BI & Microsoft Data Architecture service page.